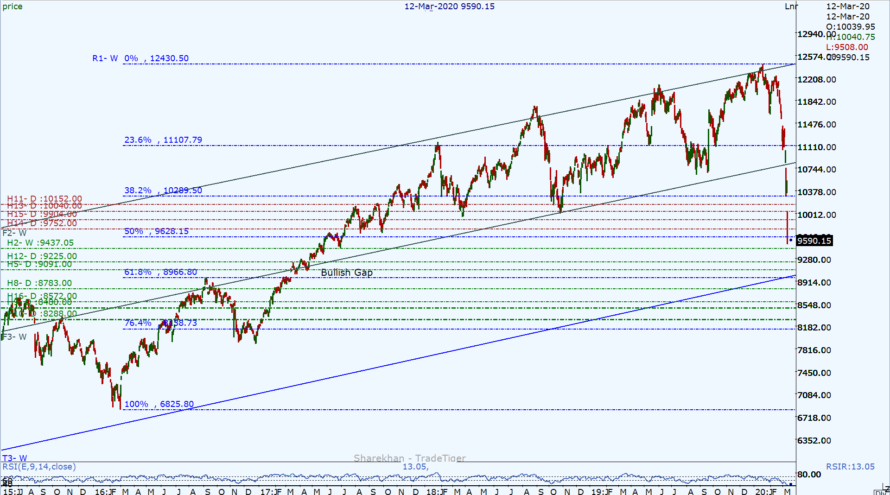
The decision to declare the Covid-19 outbreak as a pandemic by the World Health Organisation (WHO), slide in global crude oil prices and absence of positive cues from the Global Markets made a huge negative pressure on the market which affected Nifty to open deep gap down with 418.45 points at 10,039.95. The benchmark Nifty remained in the grip of bears today also making day’s low at 9,508.00 and closed at 9,590.15 with a net loss of 868.25 which biggest ever single-day fall in the history of the market. The Nifty made a huge bearish candlestick on a daily chart. On the weekly as well as on the monthly chart, the Nifty formed a bearish candle indicating a tight grip of bears on the market.
The FIIs were net sellers with a turnover of 3475.29Cr while the DIIs were net buyers with a turnover of 3918.24Cr. Heavy selling by FIIs and negative global cues created a complete negative market breadth with all the 50 stocks declining from the stack of nifty 50. The closing of Nifty at 9,590.15 is well below 200DEMA at 11,641 and a daily pivot. The daily Stochastic is at 11.23, while RSI is at 13 in the extreme oversold zone.
Nifty’s new resistance levels are 9,607, 9,752, 9,904, 10,004, and 10,154 while the support levels are at 9,437, 9,225, 9,091, 8,950, 8,572, and 8,480. The recent daily ATR of Nifty has increased substantially and along with fear with the uncertainty of the markets is making Nifty volatile. The daily trading range is very wide now from 8,572 to 9,904.
Bank Nifty also closed at 23,971.15 with a very huge loss of 2,516.65 points making a large Bearish on the daily chart. New resistance levels are at 24,180, 24,578, 24,885, 25,223 and 25,548 while key support levels are at 23,536, 23,289, 22,996, 22,574, and 22,240. The Trading range for BN looks between 22,500 to 25,200. Max OI on CE is at 28,000 and Max OI on PE is at 23,500. With the PCR for the current OC series (19th Mar) at 0.28 Bank Nifty indicates a negative bias and huge volatility.
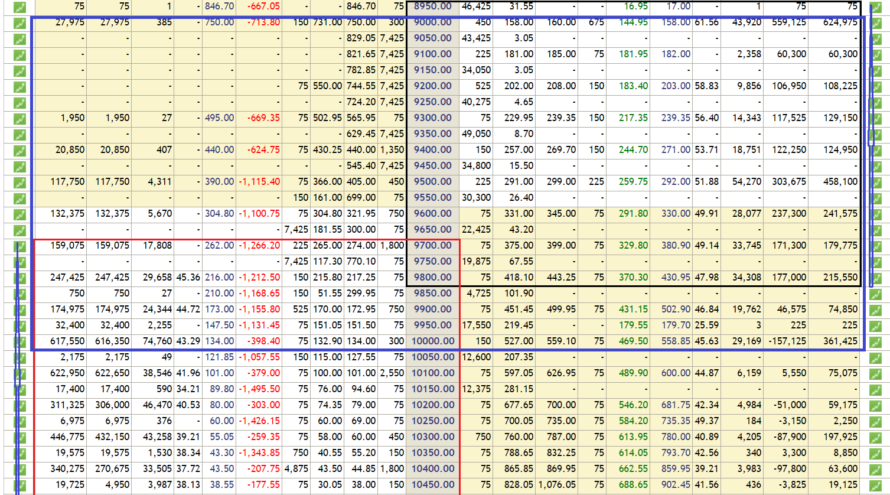
As per Nifty Option Chain data (19th Mar), Put writing was observed on all levels like 9,000 to 9,900 whereas Call writing was also seen at 9,500 to 10,500 levels. The unwinding of Call was not observed and Put was seen at the higher levels from 10,000 onwards. The resistance and support levels have moved wide on the lower side indicating more volatility in the coming sessions with negative bias. Max OI in PE is at approx 9,000 and CE is at 11,000. The PCR for the current series is 0.43 while the month-end series is 1.13 which indicates bearishness. OI data shows the possibility of the next trading range between 9,000 to 10,000 with volatile swings. Traders are advised to be careful from volatility and trade using options strategy with close stops.
Technical analysis with a sound understanding of the market is the key to trading success; however, unexpected (domestic or international) factors make the technical analysis go haywire for a while, hence we have to monitor fresh data and new dynamics of the market during trading hours to consistently make money. We trust the information will be helpful in your own analysis of the market and make trading a profitable and better experience. This analysis has been shared for educational purposes. Please seek your financial adviser’s guidance before trading or investing.
Happy Trading and Keep investing safely!