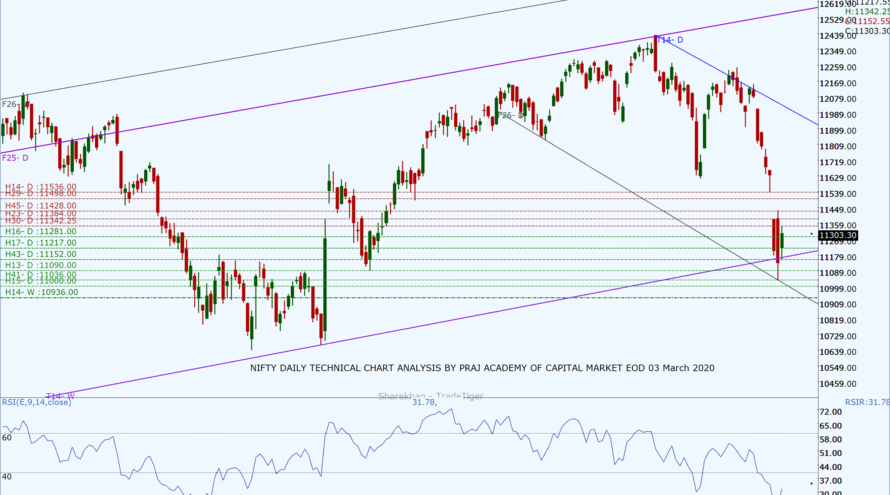
The benchmark Indices opened gap up today taking positive cues from international markets. Nifty opened with a gap of 84.80 at 11,387.35. But fear of coronavirus hits once again the market in the first half of the day which impacted nifty to see day’s low at 11,152.55. The markets moved up again after the RBI assurance to take appropriate action to ensure that financial markets will be taken care of if coronavirus impacted the economy. The stong message of RBI encouraged the Nifty with a positive bias to hit an intraday high of 11,342.25. The market closed at 11,303.30 with a net gain of 170.55 points. On the daily chart, it made a bullish candle with a Bullish Harami Pattern. On the weekly and monthly charts, the Nifty formed a Hammer pattern. International markets have also gained some lost ground today. One can expect a bounce back from this level towards 11,500.
The DIIs were net buyers with a turnover of 3135.24Cr while FIIs were net sellers with a turnover of 2415.8Cr. A total of 48 stocks advanced and 2 declined from the stack of nifty 50 to reflect a positive market breadth. The closing of Nifty at 11,303.30 is well below 200DEMA at 11,706 but above the Daily Pivot at 11,200.67. The daily Stochastic is at 16.78, in the oversold zone, while RSI is at 31.78. Nifty is in an extreme oversold zone one can expect a bounce-back towards 11,400 if the market gets some positive cues or short covering.
Nifty’s new resistance levels are 11,342, 11,384, 11,428, and 11,498 while the support levels are at 11,281, 11,270, 11,152 and 11,090. The new trading range from the chart seems to be from 11,152 to 11,498.
Bank Nifty also followed benchmark Nifty and closed at 29,177.05 with a gain of 308.65 points making a bullish candle on the daily chart with Bullish Harami Pattern. New resistance levels are at 29,295, 29,503, 29701 and 29,811 while key support levels are at 29,012, 28,863, 28,755, and 28,572. The Trading range for BN looks between 28,572 to 29,701. Max OI on CE is at 30,000 and Max OI on PE is at 28,500. With PCR for the current OC series (5th Mar) at 0.79 Banknifty indicates a slightly negative bias and volatility.
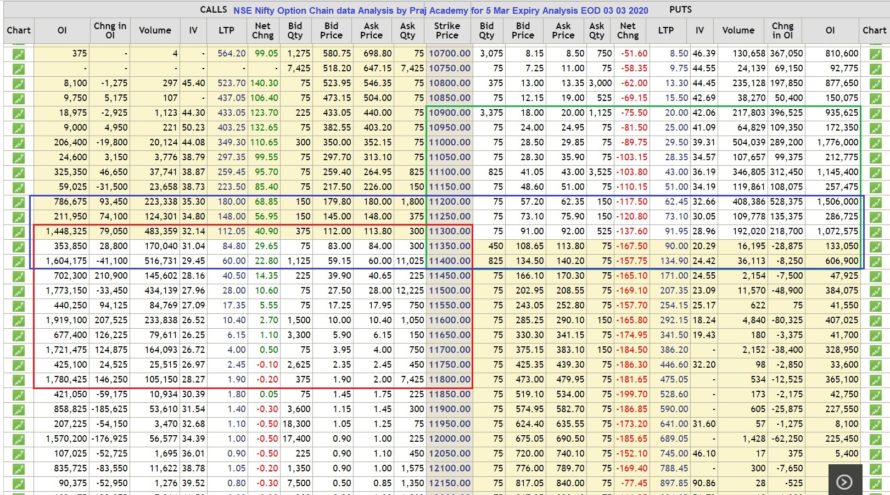
As per Nifty Option Chain data (5th Mar), Put writing was observed on 10,700 and 11,300 whereas Call writing was seen at 11,200, to 11,800 levels. The unwinding of Call was seen above 11,800 levels and Put unwinding was observed above 11,350. The resistance and support levels have moved wide indicating more volatility in the coming sessions. Max OI in PE is at 11,000 and CE is at 11,600. The data of various Option Chain series suggests the 11,000 as very strong support and it may also be the end of the correction for this season. The PCR for the current series is at 0.81 and the next series is at 0.66 indicating the fear of bulls and weakness in the Index. OI data shows the possibility of the next trading range between 11,100 to 11,500. Traders are advised to be careful from volatility and trade using options strategy with close stops.
Technical analysis with a sound understanding of the market is the key to trading success; however, unexpected (domestic or international) factors make the technical analysis go haywire for a while, hence we have to monitor fresh data and new dynamics of the market during trading hours to consistently make money. We trust the information will be helpful in your own analysis of the market and make trading a profitable and better experience. This analysis has been shared for educational purposes. Please seek your financial adviser’s guidance before trading or investing.
Happy Trading and Keep investing safely!


