Where is Nifty heading on Feb 19, 2020?
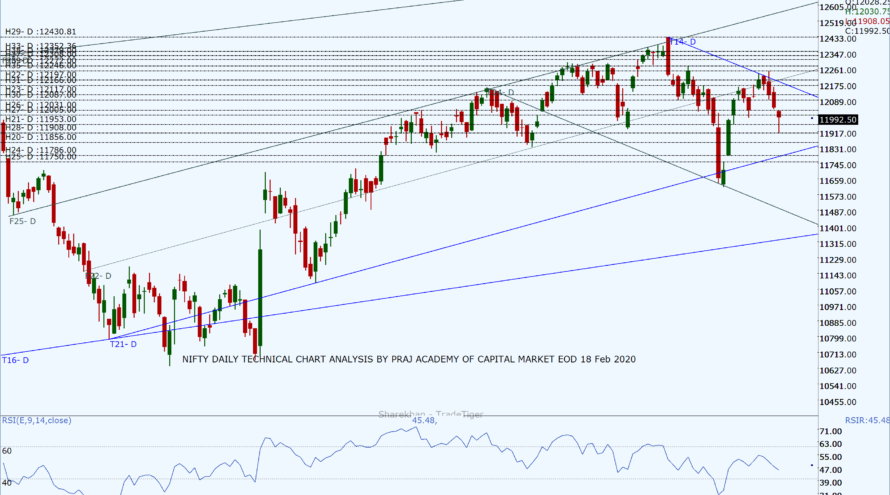
The benchmark Nifty opened 17.55 points down at 12,028.25 and touched days high at 12,030.75 but witnessed profit-booking by DIIs and FIIs also after Apple issued revenue warning and HSBC earnings missed expectations. The Nifty after touching day’s low of 11,908.05 recovered more than half of losses by the short-covering in the afternoon. It closed at 11,992.50 with a net loss of 53.30 points making a Hammer candle on the daily chart. On the weekly and monthly charts, Nifty formed a Bearish Engulfing and Doji candle respectively indicating negative bias and indecisiveness. Today also Nifty consolidated in the new range of 12,000 to 12,200 with volatility as estimated in our previous analysis. Nifty needs to get back in the new ascending channel again for its northward journey for which it will need strong cues from domestic and international markets.
The DIIs were net sellers with a turnover of 309.43Cr as well as FIIs were also net sellers with a turnover of 74Cr. A total of 20 stocks advanced, 29 declined and 1 remain unchanged from the stack of nifty 50. The closing of Nifty at 12,028.25 is below the 50 DEMA at 12,064.3 and the daily Pivot at 12,080.80. The daily RSI is at 45.48 indicating the market may consolidate some more.
Nifty’s new resistance levels are 12, 031, 12,087, 12,117, and 12,166 while the support levels are at 11,953, 11,908, 11,856, and 11,786. If Nifty slips below 11,908 level (on a closing basis) may head towards 11,750 to fill up the bullish gap and if it closes above 12,166 it will continue its journey toward 12,430. The next day trading range from the chart seems to be from 11,786 to 12,166.
Bank Nifty also faced bearish pressure. It closed at 30,562.50 with a net loss of 118.20 making a bearish candle. New resistance levels are at 30,692, 30,786, 30,874, and 30,998 while as key support levels at 30,462, 30,390, 30,252, and 30,093. The Trading range for BN looks between 30,300 to 30,700. Bank Nifty PCR for the current OC series is at 0.54 while PCR for next series is 0.72 which indicates a negative bias with consolidation.
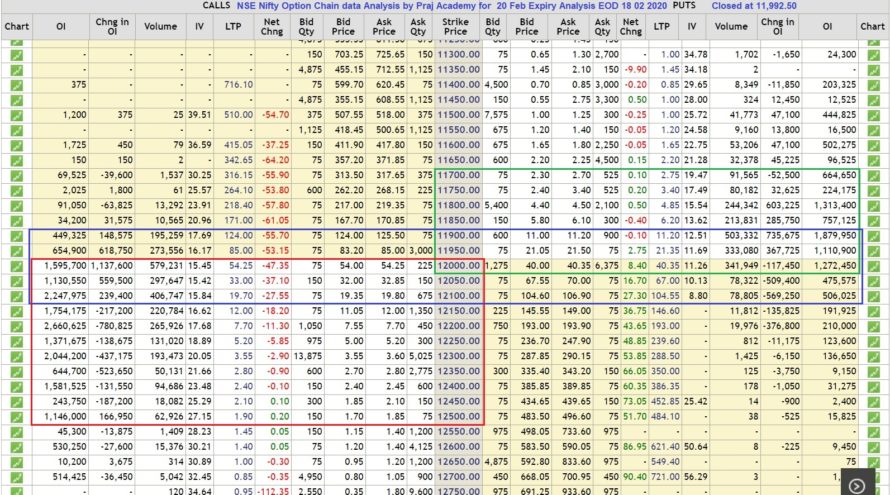
As per Option Chain data (20 Feb), Call writing was seen at 11,900 to 12,100 whereas new Put writing was observed from 11,800 to 11,950 in the current series. The resistance and support levels are wide indicating volatility in the next session. Max OI in PE is at 11,900 and CE is at 12,200. The PCR for the current series is at 0.54 and the next series at 1.03 indicating negative bias and consolidation. OI data shows the possibility of the next trading range between 11,900 to 12,100 while 11,800 to 12,100 seems to be a weekly trading range. Traders are advised to be careful and trade with close stops.
Technical analysis with a sound understanding of the market is the key to trading success; however, unexpected (domestic or international) factors make the technical analysis go haywire
for a while, hence we have to monitor fresh data and new dynamics of the market during trading hours to consistently make money. We trust the information will be helpful in your own analysis of the market and make trading a profitable and better experience. This analysis has been shared for educational purposes. Please seek your financial adviser’s guidance before trading or investing.
Happy Trading and Keep investing safely!


