Where is Nifty heading on Feb 11, 2020?
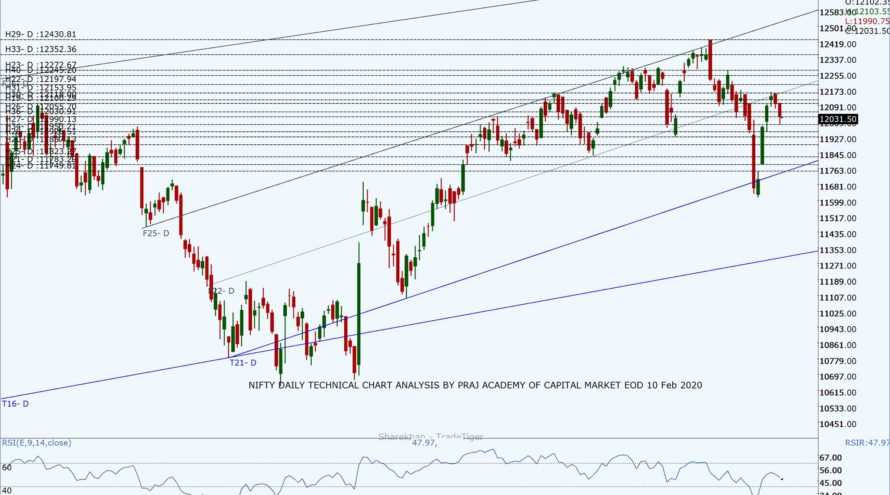
The benchmark Nifty, on Feb 10, remained in correction and consolidation mode as estimated in our previous analysis. It opened flat at 12,102.35 but profit-booking by FIIS and DIIs pushed it down to the days low at 11,990.75 before closing at 12,031.50 with a net correction of 66.85 points. On the daily and weekly chart, it made a bearish candle while as on monthly a bullish. Although Nifty is moving in an ascending channel so far, it needs strong positive cues from domestic and international markets to move in the upper orbit and continue its northward journey.
The DIIs were sellers with a turnover of 735.79Cr while FIIs were net sellers with a turnover of 184.58Cr. A total of 10 stocks advanced and 40 declined from the stack of nifty 50 indicating a negative market breadth as Coronavirus overweighs the investor’s sentiments. The closing of Nifty today had been below the 50 DEMA at 12,053, the daily Pivot at 12,109 making lower low and lower high. The daily stochastic remains in the overbought zone at 83 while RSI is at 48 indicating the market may correct and consolidate some more. Delhi election results and macro data such as WPI, CPI and IIP need to be watched out this week to steer the market.
Nifty’s new resistance levels are 12,055, 12,076, 12,103, and 12,118 while the support levels are at 11,990, 11,953, 11,926 and 11,887. If Nifty slips below 11,953 level may head towards 11,823 and if closes above 12,118 then it will continue its journey toward 12,430 The next day trading range from the chart seems to be from 11,953 to 12,153.
Bank Nifty also followed the broader market closing at 31,058.5 with a net loss of 143.8 and making a bearish candle. New resistance levels are at 31,112, 31,248, 31,302 and 31,368 while as key support levels at 30,932, 30,957, 30,833 and 30,761. The Trading range for BN looks between 30,760 to 31,400.
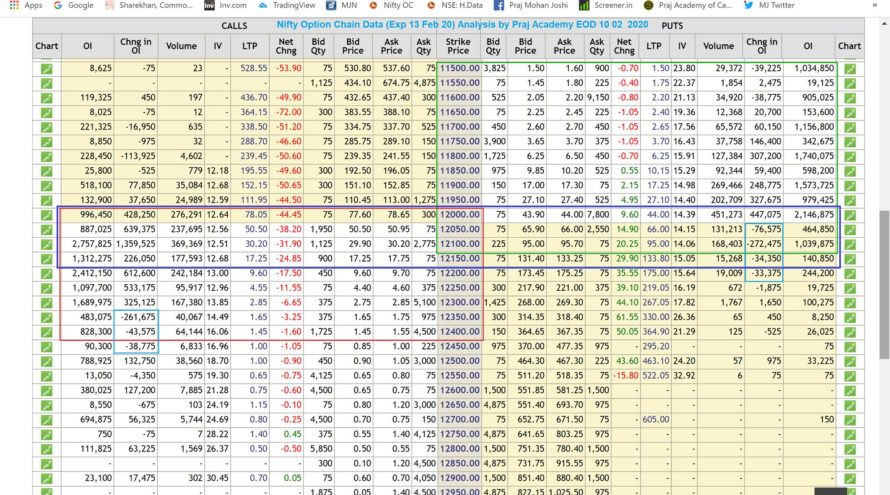
As per Option Chain data (13 Feb), Call writing was seen at 12,000 to 12,300 whereas new Put writing was observed at 11,800 to 12,000. Call unwinding at 12,350 and Put unwinding at 12,100 was observed shifting resistance and support to lower levels. Max OI in PE is at 12,000 and CE is at 12,100. The Call & Put range remains widened 11,800 to 12,400 which indicates volatility. PCR for the current series is at 0.87 and the monthly expiry series is 1.21. OI data shows the possibility of the next trading range between 11,950 to 12,150 with some more consolidation. The trading range for the week is 11,900 to 12,400. Professional traders can initiate suitable options strategies for the next trading session.
Technical analysis with a sound understanding of the market is the key to trading success; however, unexpected (domestic or international) factors make the technical analysis go haywire for a while, hence we have to monitor fresh data and new dynamics of the market during trading hours to consistently make money. We trust the information will be helpful in your own analysis of the market and make trading a profitable and better experience. This analysis has been shared for educational purposes. Please seek your financial adviser’s guidance before trading or investing.
Happy Trading and Keep investing safely!


