And where is Nifty heading on 30 Oct with new Option Series expiring on 31 October 2019?
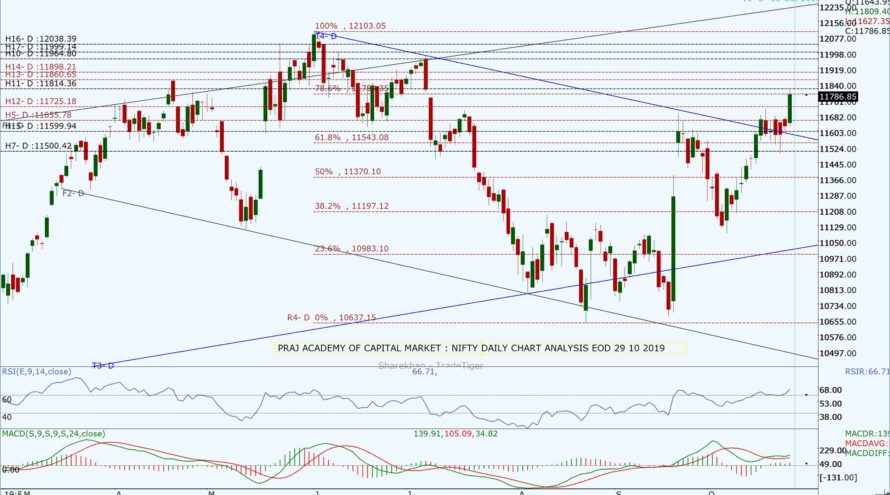
The beginning of the new Samvat 2076 has started with a big bang following a special Muhurat trading session on the day of Diwali. Nifty opened with a gap up having a gain of 16.55 points and continued its journey closing at 11786.85 with a gain of 159.7 points. The index opening was powerful with break out from descending channel and continuing its journey in the ascending channel. As mentioned in our earlier analysis, we were expecting NIfty to be mildly bullish with consolidation continued. The news of PM and FM working out on better tax alignments for investors, some healthy quarterly results of companies, US-China trade progress, and Fed Rate cut by 25bps, cheered up the market. Nifty closed the day in green making bullish candle on the daily chart as well as weekly charts. Today, the DIIs were net buyers with 144.75Cr and FIIs were net buyers with 876.64. From the Nifty50 stack, 39 stocks advanced and 11 declined.
Today’s closing at 11,786.85 is well above daily Pivot at 11,634.7, weekly Pivot at 11,596.3 and 200 DEMA at 11,257. Stochastic is at 65, RSI at 66.7 while MACD is still above zero with a bullish crossover. The market has come out of the supply zone and needs strong domestic and international cues to continue its bullish journey towards 11,900 and 12,000. The daily resistance levels are at 11,814, 11,860, 11,900 and 11964 while as support levels are at 11,757, 11,725, 11,700, 11655 and 11600 for intraday. Looking at current immediate support and resistance levels the next day trading range seems to be between 11,600 to 11,900.
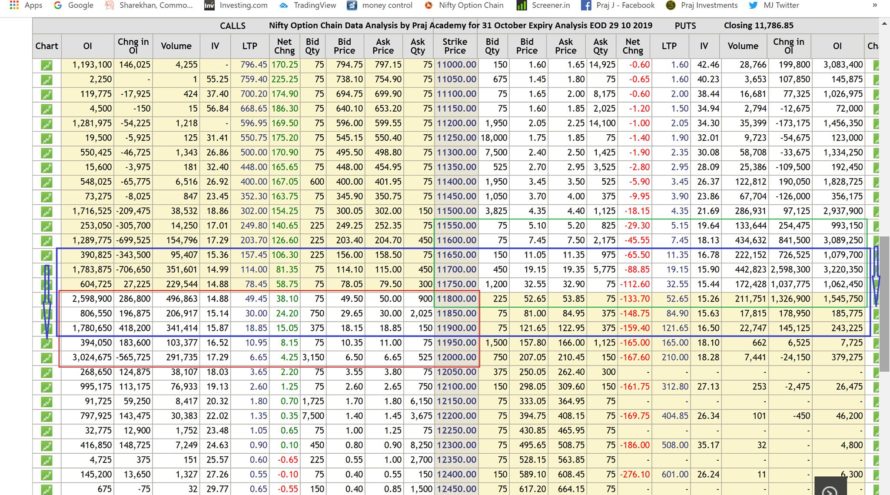
On the Options side, Put writing was seen at higher levels 11,600,11,700 and 11,700 and unwinding at lower levels like 11,400, 11300. Call writing was seen at 11,800 and 11,900 while unwinding at 11,700 and 12,000 levels. This indicates shifting support and resistance upside and bullish bias. The wider levels in Open Interest indicates volatility in the market. Looking at the Open Interest data and the PCR at 1.39, which market range seems to be in 11,600 to 11900 with bullish bias and some consolidation.
Technical analysis with a sound understanding of the market is the key to trading success, however, sometimes market forces are stronger than the past analysis. Unexpected (domestic or international) factors make the technical analysis go haywire for a while, hence we have to monitor fresh data and new dynamics of the market during trading hours to consistently make money.
We trust the information will be helpful in your own analysis of the market and make trading a profitable and better experience. This analysis has been shared for educational purposes. Please seek your financial adviser’s guidance before trading or investing.
Happy Trading and Keep investing safely!


