And where is Nifty heading coming week with new Option Series expiring on 31 October 2019?
The Sunday was a Muhurat Trading trading day, and domestic stock markets remained open for a special one-hour session on account of Diwali. Every year, the BSE and NSE conduct a special session on Diwali to mark the beginning of year Samvat. This year the Samvat 2076 has started which will end on the eve of Diwali in 2020. “Muhurat” means auspicious in Hindi, and many traders believe gains made during this session bring prosperity and wealth in the year ahead. The special trading session provides a window for investors to trade in the equities and derivatives markets briefly on the very day of Diwali. The BSE Sensex index added 4,066.15 points in Samvat 2075, marking a return of 11.62%, while the broader NSE Nifty benchmark rose 1,053.9 points or 10.01%.
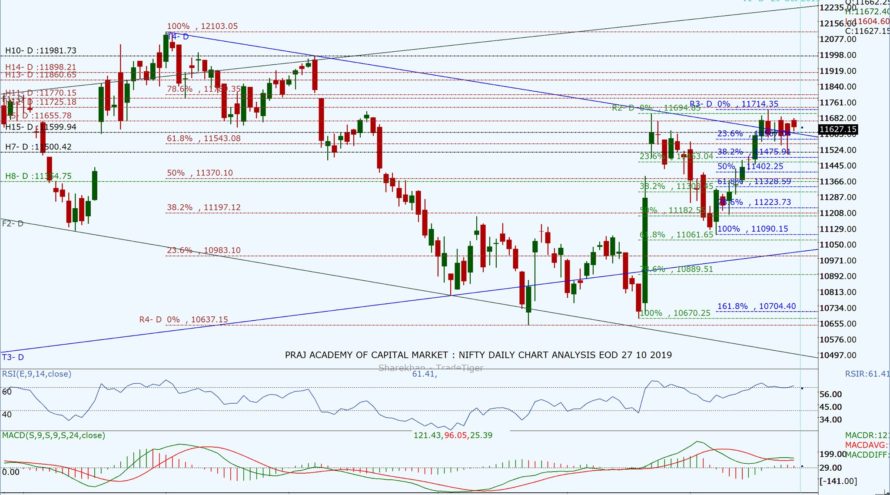
Nifty opened with a gap having the gain of 78.35 points on this Muhurat day breaking out of descending channel. Soon after profit booking started taking nifty to 11,604.6 with some buying visible and lifting Index to 11,627.40. As mentioned in our earlier analysis, Nifty is consolidating for the last few days in the range of 11,500 to 11,700. Nifty closed the day at a flat with a net gain of 43.25 points making a Spinning Top (indecisive) candle on the daily chart and a Long Laggard Doji on weekly charts which indicate some consolidation with a bullish bias. Today, the DIIs were net buyers with 54.39 Cr while FIIs were net buyers with 6.61Cr. From the Nifty50 stack, 29 stocks advanced and 21 declined.
Today’s closing at 11,627.4 is above 61.8% Fib level, above daily Pivot at 11,573.85, weekly Pivot at 11,545.23 and 200 DEMA at 11,251. The closing of the index is out of Descending Channel for now yet its surrounded by many resistances. Stochastic has cooled down at 51.57. RSI is at 61.41 while MACD is still above zero with a weak bullish crossover. The market is still in the supply zone at the double top. Nifty needs strong domestic and international cues to continue its bullish journey towards 11,725 and 11,770.
The daily resistance levels are at 11,655, 11,695, 11,725, 11,770 and 11,814. The support levels can be seen from the Nifty Daily chart at 11,600, 11,567, 11,553, 11,500, and 11,463 (61.8% Fib of recent low). Looking at current immediate support and resistance level for the next trading day seems to be from 11,500 to 11,750.
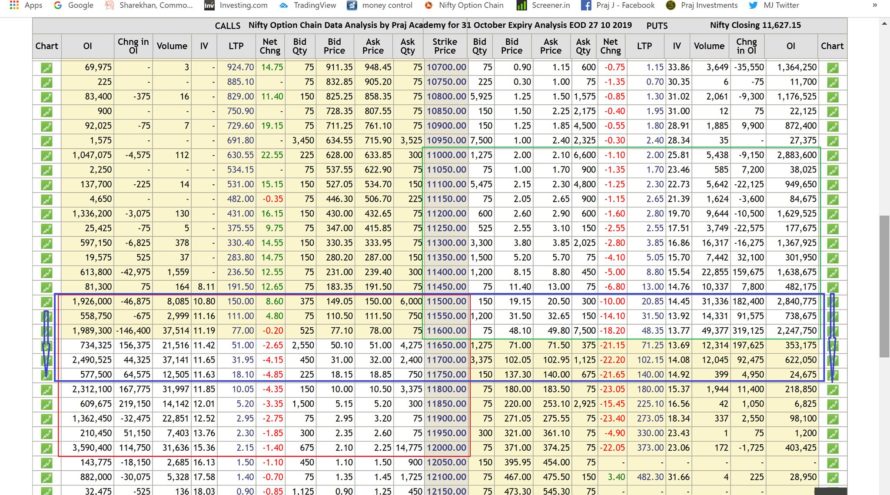
On the Options side, Put writing was seen at lower levels as well as at upper levels at 11,500,11600 and 11,700. Call writing was seen at 11,700, 11800,11,900 and 12,000 levels, thus shifting support and resistance levels very wide indicating volatility in the market in the coming week. Looking at the Open Interest data, the PCR @EOD is at 1.02, which indicates indecisiveness and some consolidation.
Technical analysis with a sound understanding of the market is the key to trading success, however, sometimes market forces are stronger than the past analysis. Unexpected (domestic or international) factors make the technical analysis go haywire for a while, hence we have to monitor fresh data and new dynamics of the market during trading hours to consistently make money.
We trust the information will be helpful in your own analysis of the market and make trading a profitable and better experience. This analysis has been shared for educational purposes. Please seek your financial adviser’s guidance before trading or investing.
Happy Trading and Keep investing safely!


