And where is Nifty heading on 27 Dec with Option series expiring on Jan 02, 2020?
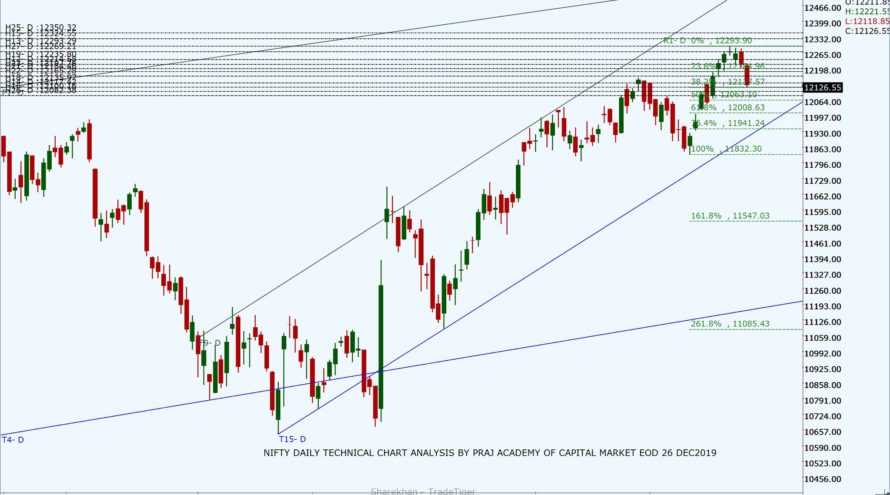
The benchmark Nifty corrected further today after opening a flat at 12,211.85. It tried to move upside for almost an hour but consistent profit booking made it bearish showing the days low at 12,118.85, taking support at 38.2% Fib retracement, before closing at 12,126.55 with a loss of 88 points on the daily chart. We, in our previous analysis, we had expected the trading range from 12,150 to 12,300 having capped upside, profit-booking at 12,250 and volatility due to monthly expiry. Nifty made a lower low and lower high in the daily chart yet again making a large bearish candle. It made a bearish candle on the weekly and ‘’Long Laggard Doji” candle in the monthly chart indicating some more correction may be on the cards. However, the Bollinger Bands were expanding upwards in all the time frames indicating the midterm bullish strength and volatility.
The DIIs were net buyers today with a turnover of 120.46 while FIIs were net sellers with 504.13Cr. Total 14 stocks advanced, 36 declined from the stack of nifty 50. Today’s closing at 12,216.55 is below 13 DEMA at 12,136, below daily Pivot at 12,233 and above weekly pivot at 12,204. The Index is still moving within the daily ascending channels. Stochastic has cooled down to at 43 (from the overbought zone at 91) whereas RSI has become weak at 55.3 and MACD is above zero with a bullish crossover with decreasing bullish strength indicating some more consolidation. However, Nifty is at 38.2%, a strong Fibonacci level from the low of 11,832 may show some pullback or surprise reversal.
Nifty’s new resistance levels are 12,235, 12,269, 12,293, 12,324, and 12,350 while as the support levels are at 12,202, 12,196, 12,182 and 12,165. Looking at current immediate support and resistance level for the next trading day seems to be from 12,165 to 12,324. If Nifty slides below 12,165 level on a closing basis, it may initiate a corrective towards 12,117 (38% Fib retracement from 11,832 to 12,294 move) before resuming it’s up moving towards 12,350 to 12,408.
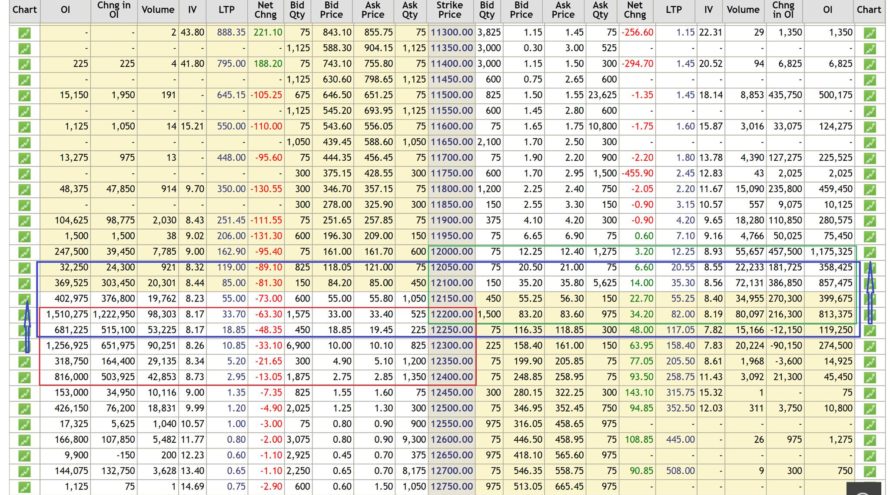
As per Option Chain data new Put writing was seen at 12,150, whereas Call writing was seen at 12,200, 12,250, 12,300, and 12,350 levels shifting support and resistance levels downside. The unwinding of Calls was across 12,100, 12,150 and 12,400 and Put unwinding at 12,000, 12,200,12,300 indicating weakening support base at higher levels. OI data shows a possibility of the next trading range between 12,150 to 12,300 with good volatility due to options expiry and broader OI base. The PCR has reduced to 0.88 for the current OC series which indicates bearishness which may add to volatility and short term correction or consolidation.
Technical analysis with a sound understanding of the market is the key to trading success; however, unexpected (domestic or international) factors make the technical analysis go haywire for a while, hence we have to monitor fresh data and new dynamics of the market during trading hours to consistently make money. We trust the information will be helpful in your own analysis of the market and make trading a profitable and better experience. This analysis has been shared for educational purposes. Please seek your financial adviser’s guidance before trading or investing.
Happy Trading and Keep investing safely!


