And where is Nifty heading coming week with new Option Series expiring on 31 October 2019?
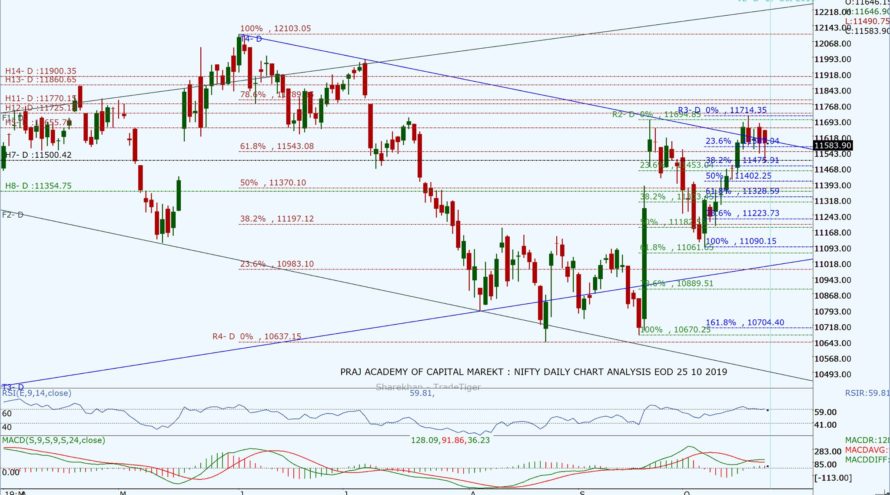
Nifty has been in consolidation and opened gap up with the gain of 62.55 points yet it could not break its supply zone. In our previous analysis, we had mentioned neutral and indecisive bias with consolidation as our view for today. With Nifty touching the days high at 11,46.15, profit booking started in setting up the bearish mood in the market and dragging the Index to days low at 11,490.75. It was only last two hours where the market pepped up seeing excellent quarterly results of SBI and a few more which fired BAnkNifty up. Nifty closed the day at a flat note with a net gain of 1.30 points making a hammer candle on the daily chart and a Bearish Harami on weekly charts. Today, the DIIs were net buyers with 440.18 Cr while FIIs were net sellers with -435.42Cr. From the Nifty50 stack, 19 stocks advanced and 31 declined.
Today’s closing at 11,583.9 is below 61.8% Fib level, below daily Pivot at 11,598.95, above weekly Pivot at 11,545.23 and 200 DEMA at 11,249. The closing of the index is still in the Descending Channel yet again and is surrounded by many resistances. Stochastic has cooled down at 52.45. RSI is sideways at 58.81 while MACD is still above zero with a bullish crossover. Besides the market is in the supply zone at the double top. Nifty needs strong domestic and international cues to continue its bullish journey towards 11,725 and 11,770.
The daily resistance levels are at 11,600, 11,655, 11,695, 11,725, 11,770 and 11,814. The support levels can be seen from the Nifty Daily chart at 11,588 (61.8% Fib of recent High), 11,553, 11,500, and 11,463 (61.8% Fib of recent low). Looking at current immediate support and resistance level for the next trading day seems to be from 11,400 to 11,700.
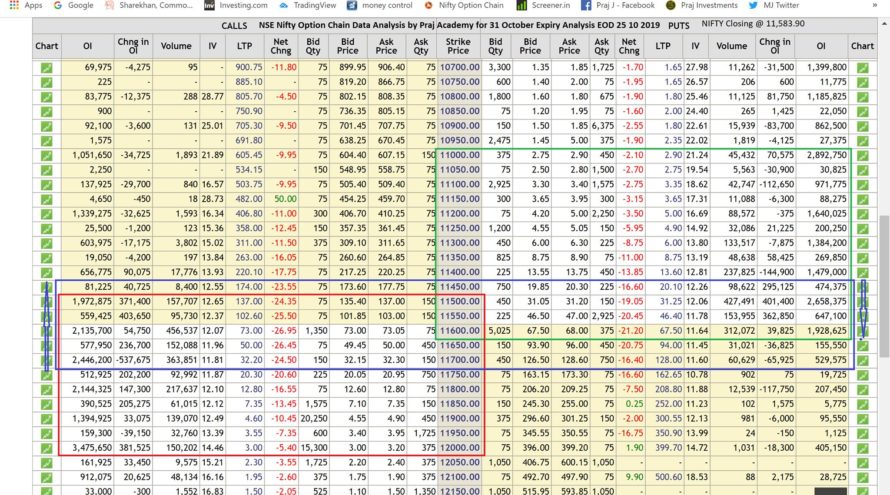
On the Options side, Put writing was seen at lower levels as well as at upper levels at 11,500 and 11,600. Call writing was seen at 11,600, 11,700, 11800 and 12,000 levels, thus shifting support and resistance levels very wide indicating volatility in the market in the coming week. Looking at the Open Interest data the PCR @EOD came down at 0.99, which indicates indecisiveness and some consolidation.
Technical analysis with a sound understanding of the market is the key to trading success, however, sometimes, unexpected (domestic or international) factors make the technical analysis go haywire for a while. Market forces are stronger than our analysis sometimes, and we have to monitor fresh data and new dynamics of the market during trading hours to consistently make money.
We trust the information will be helpful in your own analysis of the market and make trading a profitable and better experience. This analysis has been shared for educational purposes. Please seek your financial adviser’s guidance before trading or investing.
Happy Trading and Keep investing safely!
27
Oct
Nifty and Market Analysis @ EOD on 25 10 2019
-
Authoradmin
-
Comments0 Comments
-
Category
Tags:


