And where is Nifty heading on expiry of this weekly Option series on Dec 19, 2019?
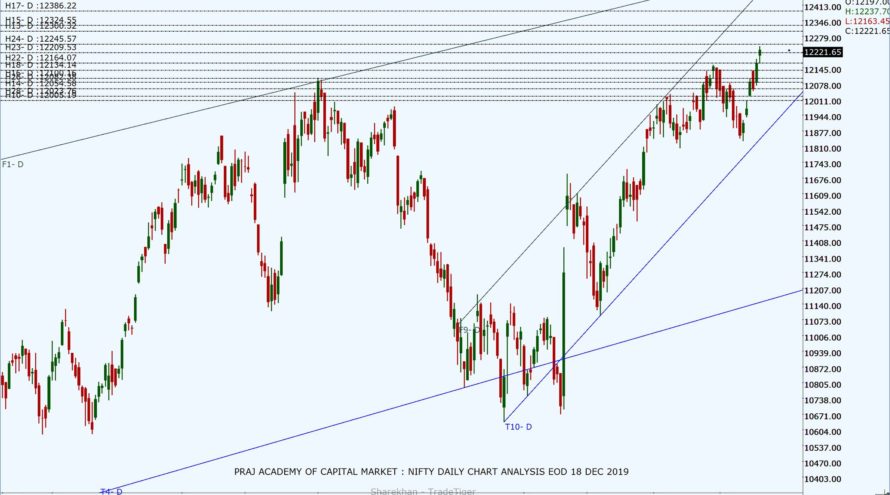
The benchmark index Nifty continues its bullish journey in the morning with a net gain of 32 points on a gap-up move opening at 12,197. It maintained its bullish bias with some profit booking at 12,210 before moving up some more and closing at 12,221.65 with a net gain of 56.65 points. In our previous analysis, we had expected a range-bound move between 12,100 to 12,250 with bullishness. Positive global cues fuelled Nifty to see an all-time high of 12,237.70. It made a bullish candle on the daily, weekly, and monthly chart with Bollinger Band expanding upwards in all the time frames indicating the midterm bullish strength.
The DIIs were net sellers today with a negative turnover of 1,267.58Cr while FIIs were net buyers with 1,836.81Cr. Total 33 stocks advanced, and 17 declined from the stack of nifty 50. Today’s closing at 12,221.65 is well above 13 DEMA at 12,043, daily Pivot at 12,139.37 and weekly pivot at 12005.95. The Index is moving within the daily ascending channels. Stochastic, at 87.65 (overbought zone) whereas RSI has strengthened to 65.35 and MACD is above zero with bearish crossover but increasing bullish strength indicating some bullish bias in Nifty.
Nifty’s new resistance levels have shifted upwards to 12,237, 12,255, 12,290, 12,300, and 12,345. The support levels are at 12,209, 12,188, 12,165, 12,145 and 12,100. Looking at current immediate support and resistance level for the next trading day seems to be from 12,145 to 12,255. Nifty has completed the pullback move (Wave 4) which now can lead it to Leg 5 of the Elliott Wave if NIfty continues to sustain above 12,200 on the closing basis for which Nifty would need strong cues to continue its journey towards 12,255 and 12,350. If Nifty slides below 12,050 level on a closing basis, it may initiate a corrective before resuming it’s up moving towards 12,255.
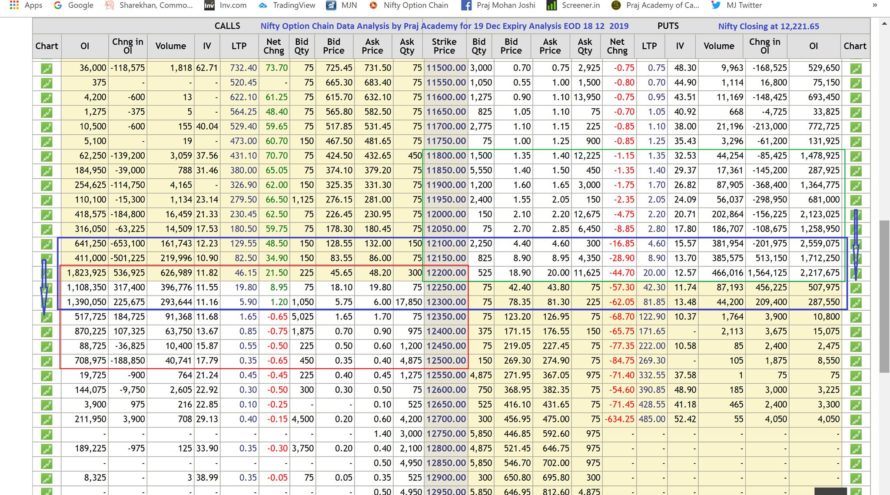
As per Option Chain data new Put writing was seen at higher levels like 12,150, 12,200,12,250 and 12,300 whereas small Call writing was seen at 12,200, 12,250 and 12,300 making resistance weak and levels shifting support and resistance levels upside. The unwinding of Calls was across 12,100 to 12,150 and Put unwinding at lower levels at 12,000, 12,050, 12,100 and 12,150 indicating strong support base on upper levels. OI data shows a possibility of the next trading range between 12,150 to 12,250 having capped upside. The weekly trading range seems to be broader from 12,000 to 12,324. The PCR, today, of current OC series is at 1.855 while as 1.51 for 26 Dec series OC which indicates further bullishness. Profit looking is expected at 12,250 level which may add to volatility and short term correction/consolidation.
Technical analysis with a sound understanding of the market is the key to trading success; however, unexpected (domestic or international) factors make the technical analysis go haywire for a while, hence we have to monitor fresh data and new dynamics of the market during trading hours to consistently make money. We trust the information will be helpful in your own analysis of the market and make trading a profitable and better experience. This analysis has been shared for educational purposes. Please seek your financial adviser’s guidance before trading or investing.
Happy Trading and Keep investing safely!


