And where is Nifty heading next week on 22nd October, 2019?
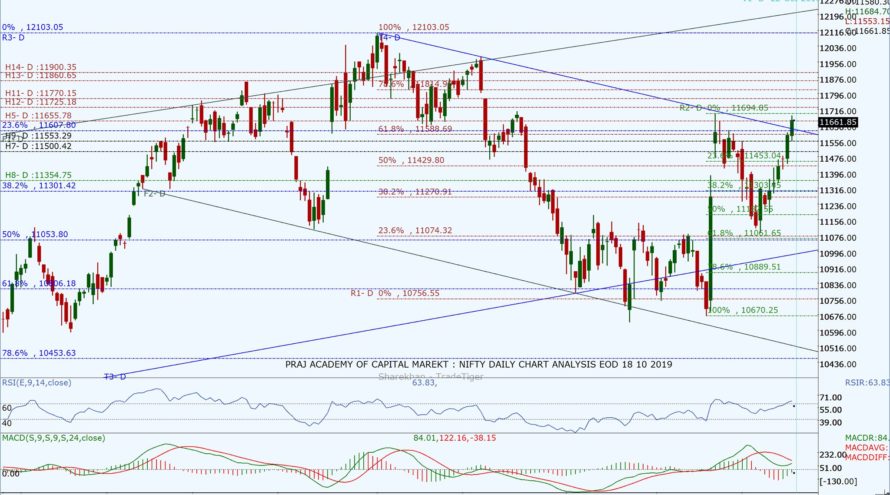
Nifty maintained a bullish pace with good gains for the last six consecutive trading days. Nifty started the day at 11,580.3 with a loss of few points and touched days low at a crucial support level of 11,553. The index remained bullish after touching the days high at 11,684.7 with some profit booking at higher levels it closed at 11,661.85 with a healthy gain of 75.5 points forming a bullish candle on the daily chart making higher highs and higher lows consistently for the last 6 trading days. Today, the DIIs were net buyers with 586.88Cr while FIIs were net buyers with 36.56Cr. From the Nifty50 stack, 35 stocks advanced and 15 declined.
Today’s closing at 11,661.85 is well above the daily Pivot at 11,541.7, weekly Pivot at 11,252.70 and 200 DEMA at 11,234. Nifty broke out of the upper trend line of Descending Channel and need to sustain above it to continue upwards journey. The Index has got multiple layers of resistance to cap the upside on the daily chart. Stochastic remains in overbought zone and is at 95, thus, indicating for consolidation or a small correction. RSI has strengthened further and it is at 63.83 while MACD is still above zero with a bearish crossover with bullish strength building up. Besides the market is in the supply zone at double top. Nifty needs strong domestic and international cues to cross 11,695 levels decisively to continue its bullish journey towards 11,725 and 11,770.
The daily resistance levels are at 11,695, 11,725, 11,770 and 11,814. The support levels can be seen from the Nifty Daily chart at 11,655,11,607, 11,588, 11,553, 11,500, and 11,463 (61.8% Fib of recent low). If Nifty breaks below 11,620 on closing and the sustainable basis on the daily chart, it may consolidate or correct for a while. Looking at current immediate support and resistance level for the next trading day seems to be from 11,500 to 11,750.
On the Option side, new Put writing was seen at higher levels like 11,500, 11,600 shifting support base upside. Call writing was seen at 11,700, 11800 and 12,000 levels thus shifting resistance levels upside. Also, Option data is a wider range now indicating volatility in the coming week. Looking at the Open Interest data at various strike rates along with the strike shifting forces indicate the possibility of the next trading range between 11,500 and 11,700. The PCR @EOD remains at 1.35 which indicates a mild bullish bias with some consolidation.
Technical analysis with a sound understanding of the market is the key to trading success, however, sometimes, unexpected (domestic or international) factors make the technical analysis go haywire for a while. Market forces are stronger than our analysis sometimes, and we have to monitor fresh data and new dynamics of the market during trading hours to consistently make money.
We trust the information will be helpful in your own analysis of the market and make trading a profitable and better experience. This analysis has been shared for educational purposes. Please seek your financial adviser’s guidance before trading or investing.
Happy Trading and Keep investing safely!


