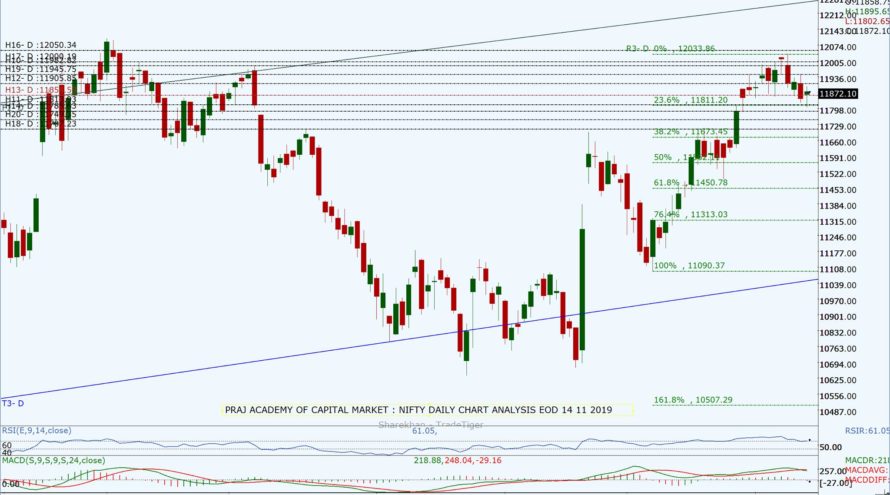
And where is Nifty heading this week on 18 Nov with Option Series expiring on 21 Nov 2019?
In our previous technical analysis, we had expected a bullish bias with a range-bound move of Nifty and it being volatility at level of 11,950 due to profit booking. Nifty opened at 11,904.1 with a gap-up gain of 32.1 points and had a bullish pressure most of the day despite witnessing profit booking at approximately 11,970 level in the morning. it was the one and a half hour which created sharp sellout at 11,960 level taking the Nifty to days low at 11,879.25. Nifty closed with a net gain of 23.35 points at 11,895.45 at the end of the day, forming a Doji candle on the daily chart. The FIIs were bearish today with the selling of -1008.37Cr while DIIs were the net buyers with 537.74 Cr. From the Nifty 50 stack, only 19 stocks
advanced and 31 stocks declined.
Nifty closing is above daily Pivot at 11,836.8, weekly Pivot at 11,930.8 and above 200 DEMA at 11,330. Stochastic is at 26 (close to Oversold Zone), RSI is at 62.15 while MACD is still above zero with a bearish crossover indicating the correction and consolidation phase. Nifty has made a higher high and higher low indicating Nifty’s bullish structure is intact in the midterm. However, on a weekly chart, Nifty has shown a flat closing with bearish bias. If the index manages to sustain above 11,945, then we may see its bullish journey towards 12,000 to 12,100. Nifty closing below 11,790 on EOD basis may take it towards 11,707. The daily resistance levels are at 11,905, 11,945, 11,973 and 12,005 while as support levels are at 11,891, 11,855, 11,814, and 11,786 for intraday trading. On an intraday chart, Nifty seems to be bearish below 11,891 heading towards 11,800. Looking at current immediate support and resistance levels at 60 minutes chart the next day trading range seems to be between 11,760 to 12,050.
On the Options front Put writing was seen at 11,700, 11,800, 11,900 levels while Call writing was seen at 11,900,12,000 and 12,100 levels indicating the shifting of support and resistance levels on upper sides but having a range indicates a range-bound session. Looking at the Open Interest data and the unchanged PCR at 1.03 the market range seems to be in the range of 11,786 to 11,950 for intraday with some correction and consolidation. Profit booking is expected as Nifty approaches 11,960, which may turn market volatile and choppy in intraday. The other inputs to impact the market are domestic and international cues.
Technical analysis with a sound understanding of the market is the key to trading success, however, sometimes market forces are stronger than the past analysis. Unexpected (domestic or international) factors make the technical analysis go haywire for a while, hence we have to monitor fresh data and new dynamics of the market during trading hours to consistently make money.
We trust the information will be helpful in your own analysis of the market and make trading a profitable and better experience. This analysis has been shared for educational purposes. Please seek your financial adviser’s guidance before trading or investing.
Happy Trading and Keep investing safely!


