Nifty and Market Analysis @ EOD on 12 09 2019…..
And where is it heading this weekend on 13th, 2019?
The day belonged to bears today. The lack of bullish strength was well indicated by yesterdays closing with a small Doji candle showing indecisiveness.
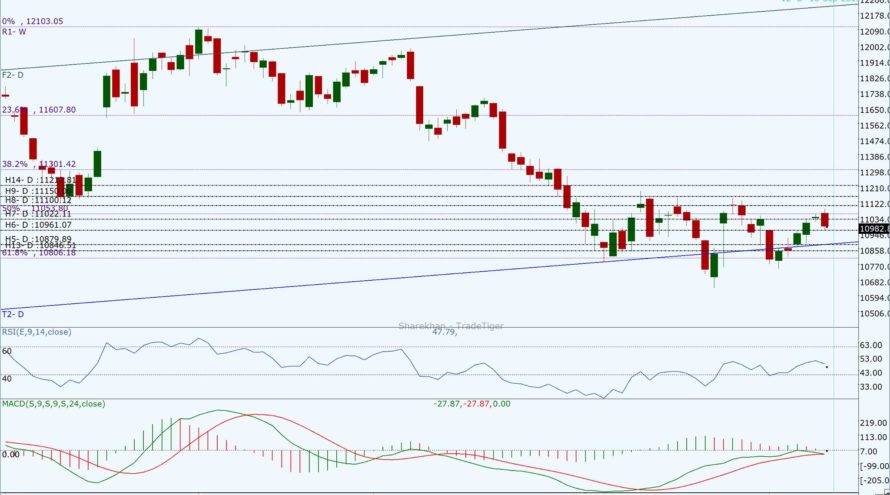
Nifty opened the gap up with gain of 22.6 points inching towards 11,100 but could not see beyond days high of 11,081.75 at 10.00am. Bulls could not maintain the buying after that and bears took it over for the entire day closing the day at 10,982.8 and making a large bearish engulfing candle on the daily chart with a net loss of 52.90 points during the day. Nifty maintained presence in it’s Ascending channel maintaining its higher highs but did not mange higher lows momentum.
Today’s closing is well below daily Pivot at 11,034.05, but above the Weekly Pivot at 10,886.68. On the weekly chart, it has made a spinning top candle after making a Dragonfly Doji last week at Golden Fibonacci level which indicates indecisiveness. Stochastic is in overbought zone at 82.48 and RSI in sideways at 47.79 and Bollinger band further squeezed thus capping the wider swings.
Consolidation of Nifty continues before any large move for which Bollinger bands remain range-bound for quite some time now. Nifty Index is surrounded with resistance at 11,004, 11,053.8 (50% Fib Level), 11,100, 11,150 and 11,200. To move up with velocity, Nifty will need strong external cues for domestic and international markets.
On the downside, it has support 10,961, 10879.6, 10,961, 10,806 (61% Fib wrt 26 Oct 2018), and 10,746 (Closing of 5th Sept). To resume its bullish move, Nifty needs to cross and sustain above 11,150 on a closing basis. Looking at current immediate support and resistance level this weekend Nifty may rest in the range of 10,900 to 11,100.
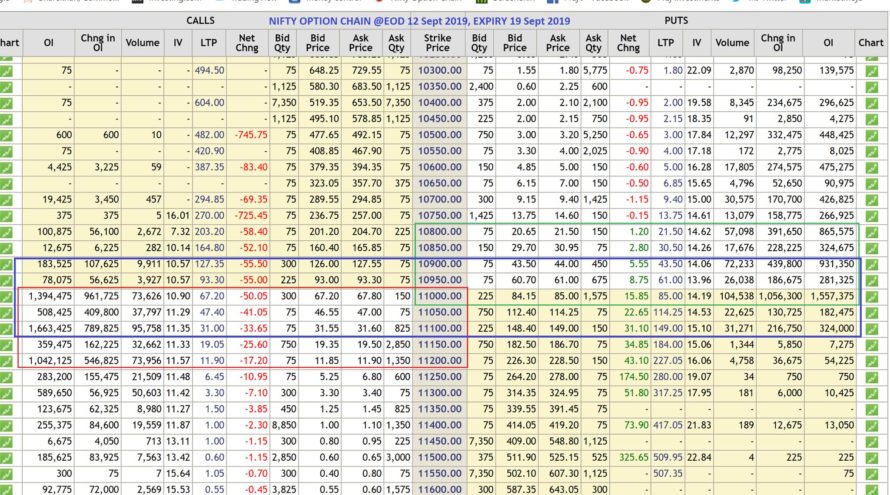
As per Option Chain data the trading range is still broad from 10,800 to 11,200. Looking at the Open Interest data at various strike rates along with the strike shifting force, it seems that the range for this weekend on 13th September i.e. the last trading day of this week could be11,900 to 11,000. While the Retail clients are bullish on the options front, FIIs, DIIS, and PROs are bearish with a downward bias.
Client Idx CeLong Index PeLong Idx CeShort Inx PeShort
Retailer 4,19,336 3,53,850 4,29,448 6,07,934
DII 20,401 98,359 – –
FII 1,93,712 3,01,397 1,22,460 1,12,569
Pro 1,16,758 1,35,057 1,98,299 1,68,160
As per Option Chain data the trading range is still broad from 10,800 to 11,200. Looking at the Open Interest data at various strike rates along with the strike shifting force, it seems that the range for this weekend on 13th September i.e. the last trading day of this week could be10,900 to 11,100. While the Retail clients are bullish on the options front, FIIs, DIIs, and PROs are bearish with a downward bias.
PCR @EOD (for Nifty Expiry on 19 Sept OC) has decreased to 1.02 from 1.46 (from previous trading day) which indicates indecisiveness outlook for the next trading day. The PCR for September month (including next two expires) has also decreased to 1.10 from 1.16 from the previous day reducing the power of bulls for tomorrow, nevertheless, let’s look at how Option data changes during trading hours.
We trust the information provided will be helpful in your analysis of the market and make trading a profitable and better experience. The information has been shared for educational purposes. Please seek your financial adviser’s guidance before trading or investing.
Happy Trading and Keep investing safely!


