And where is Nifty heading on Dec 12 with weekly expiry of this series of Option?
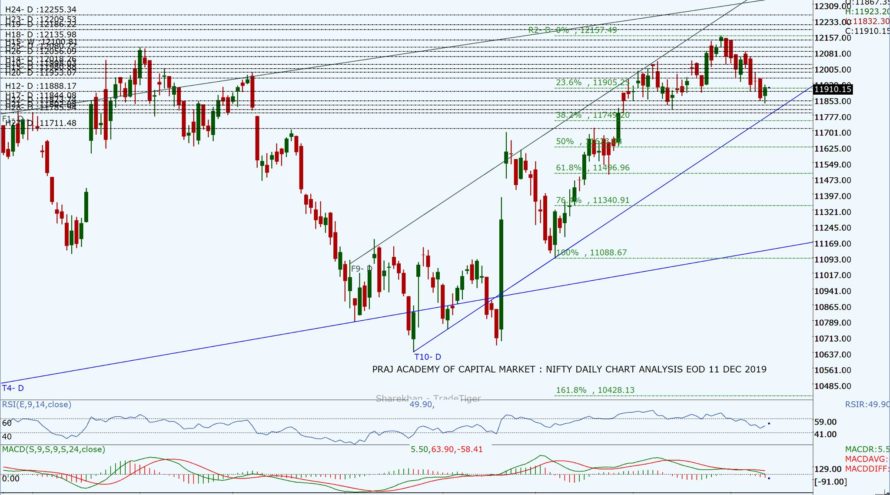
Today, Nifty opened with a small gain of 10.55 points at 11,867.35 and had a continuous selling pressure touching the days low at 11,832.3. The Index closed at 11,910.15 with a net gain of 53.35 making a “Bullish Harami” candle on the daily chart. We had expected NIfty in the range of 11,700 to 12,000 with volatility in our previous analysis. Nifty is approaching the lower trendline of narrow Ascending channel at 11,750 which also happens to be 38% retracement from its move initiating from the low of 11,088 on October 09, 2019. There is good support at 11,800 from the lower band of Bollinger. On the weekly chart, Bollinger Band is still indicating the midterm bullish strength remains in the trend. In 60 minutes, Nifty has touched the lower trend line of the descending channel and is in a pullback move. Although Nifty is in short term correction however the midterm bullish bias is still there as per technical charts and indicators. The market will look forward to cues from weekly scheduled events such as US-China trade talk developments, Fed Policy on 12th Dec, UK Election results on Thursday, and domestic macro data from the outcome of Cabinet meeting, CPI, IIP, and WPI and international markets.
The DIIs were net buyers today with 605.41 Cr while FIIs were net buyers with 239.87. Total 32 stocks advanced, and 18 declined from the stack of nifty 50. Today’s closing at 11,910.15 is below 13 DEMA at 11,962, daily Pivot at 11,884.90. The Index is well above the midway of the daily ascending channel (broader) and has got multiple resistances. Stochastic, at 20.67 is still around the oversold zone whereas RSI is at 49.90 and MACD is above zero with bearish crossover are indicating some more correction and consolidation on board.
Nifty’s new resistance levels have shifted upwards to 11,953, 11,980, 11,998, 12,056, 12,080 and 12,100. The support levels are at 11.900, 11,888, 11,844 and 11,823, 11,802. Looking at current immediate support and resistance level for the next trading day seems to be from 11,800 to 12,000. Nifty has entered in a short term correction phase and would need strong domestic and international cues to move above 12,050 to continue its journey towards 12,150 and 12,200. If Nifty slides below 11,840 level on a closing basis, it may initiate a downside corrective move towards 11,750 level.
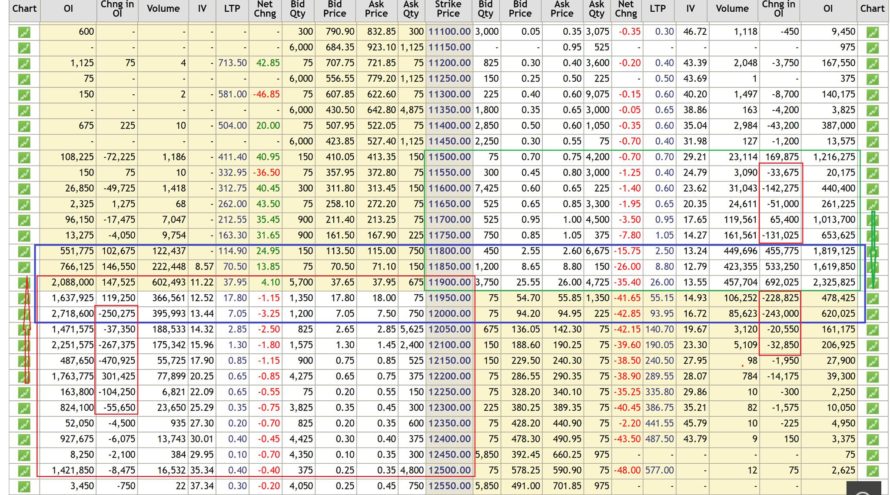
As per Option Chain data new Put writing was seen at lower levels like 11,800, 11,850 and 11900 whereas call writing at 11,900, 11,950 and 12,000 levels shifting resistance at the lower level. The unwinding of call was noticed at 12,000, 12,050 and 12,100 levels and Put unwinding at 11,950 and 12,000 levels. The trading range has shifted quite wide, indicating volatility in coming trading sessions. Looking at the Open Interest data there is a good possibility of the next trading range between 11,800 to 12,000. The PCR of this option chain series is 0.66 whereas the Dec 26 series is 1.17 for series which indicates current corrections in NIfty may fade soon. If the index moved toward 11,950 to 11,990 some profit booking may start which may further lead to volatility.
Technical analysis with a sound understanding of the market is the key to trading success, however, sometimes market forces are stronger than the past analysis. Unexpected (domestic or international) factors make the technical analysis go haywire for a while, hence we have to monitor fresh data and new dynamics of the market during trading hours to consistently make money. We trust the information will be helpful in your own analysis of the market and make trading a profitable and better experience. This analysis has been shared for educational purposes. Please seek your financial adviser’s guidance before trading or investing.
Happy Trading and Keep investing safely!


