And where is Nifty heading on 09 Jan on the weekly expiry?
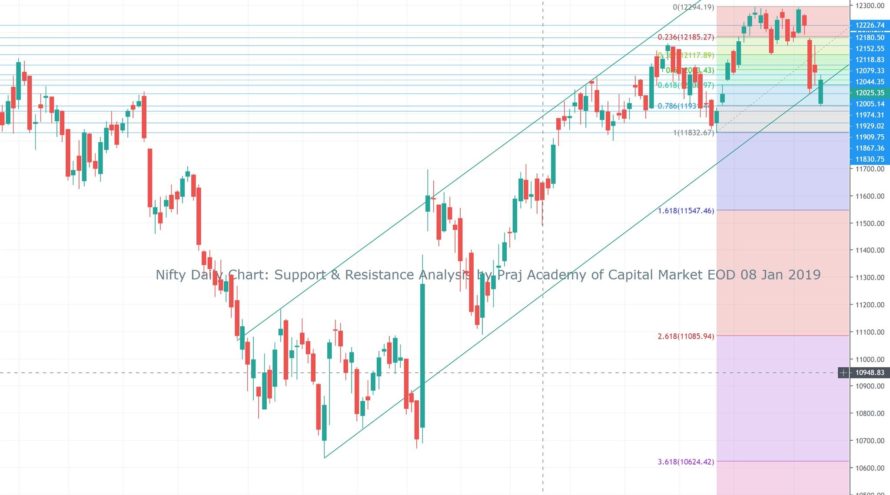
The fear of possible war kind of situation between the US and Iran, after Iran fired more than dozens of missiles on US troops at Iraqi facilities, triggered a negative impact on Stock Market. The Nifty opened with a gap down with the net loss of 113.9 points at 11,939.10 and made to the lowest of the day at 11,929.60. Nifty gradually started recovering in the afternoon session of trading and closed with a loss of 27.60 at 12025.35. NIfty made a Bullish candle on daily and bearish candlestick on weekly & monthly charts. The Bollinger Bands is in a narrow mode in monthly time frames indicating the midterm volatility in the coming sessions. For the last two weeks, nifty has been consolidating in a range of 12,100 to 12,300 which got broken today shifting the new range to 11,800 to 12,200. To continue its bullish journey Nifty needs to sustain above 12,250 on a closing basis, however, the upside is capped at present due to week macros and absence of positive cues from domestic and international markets. The downside in Nifty seems to be capped at 11,832 at present.
The DIIs were net buyers today with a turnover of 748.4Cr while FIIs were net sellers with 515.85Cr. Out of the stack of nifty 50, 21 stocks advanced today while 29 declined. Today’s closing at 12025.35 is well below the 13 DEMA at 12130, daily Pivot at 12070.15 and weekly pivot at 12,222. The MACD and RSI have gone in sideways to a bearish mode so some consolidation and correction can be expected in the coming sessions.
Nifty’s new resistance levels are 12,044, 12,079, 12,118, 12,152, 12,178, 12,200, 12,226 and 12,261 while as the support levels are at 12,005, 11,974, 11,929, 11,910 and 11,867. Looking at current immediate support and resistance level for the next trading day seems to be from 11,900 to 12,150. If Nifty is able to cross 12,152 on the closing basis it will continue it’s up moving towards 12,300 and if it slides below 11,910 level on a closing basis, it may initiate a correction towards 11,832.
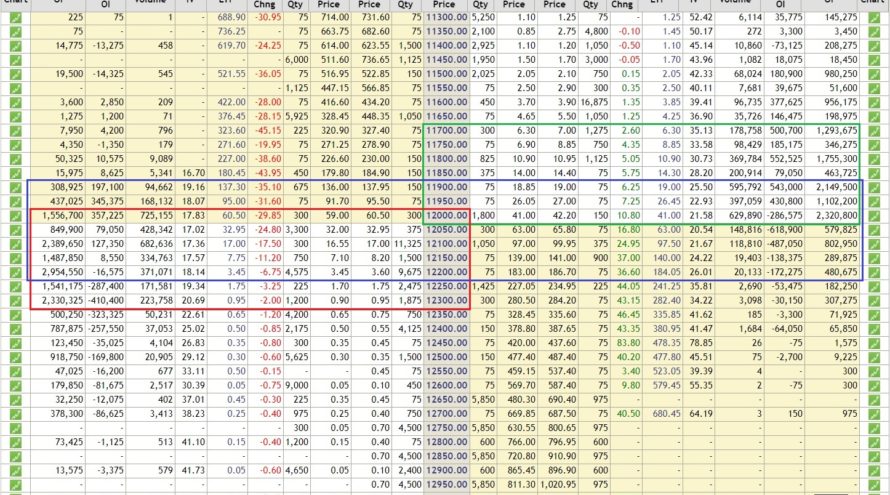
As per Option Chain data, Call writing was seen at 11,900 to 12,100 levels whereas new Put writing was observed on much lower levels like 11,500 to 11,950 levels. The unwinding of Calls observed on higher levels like 12,250, 12300, 11,350, and 11,400 whereas unwinding of puts seen at 12,000 to 12,250. Max OI in PE is at 12,000 and CE is at 12,200. The Call & Put range has shifted downside and also on the broader side indicating bearishness with volatility. OI data shows the possibility of the next trading range between 11,900 to 12,200. The current PCR is bearish at 0.87 for current OC and at 1.26 for the next OC series expiring on 16th Jan which indicates Bullishness with some consolidation. This week the market will mainly be governed by the developments happening in the middle east and how the allies get aligned in the process of peace or war. Traders are advised not to initiate fresh long positions till there are truce and peace between the US and Iran.
Technical analysis with a sound understanding of the market is the key to trading success; however, unexpected (domestic or international) factors make the technical analysis go haywire for a while, hence we have to monitor fresh data and new dynamics of the market during trading hours to consistently make money. We trust the information will be helpful in your own analysis of the market and make trading a profitable and better experience. This analysis has been shared for educational purposes. Please seek your financial adviser’s guidance before trading or investing.
Happy Trading and Keep investing safely!


