And where is it heading from Oct 09 to Oct 10, 2019?
Nifty opened the gap up with a gain of 21.45 points at 11,196.20, however, the negative sentiment drove by selling in IT and Auto stocks coupled with weak global cues drove NIfty to 11,126.4 with a net loss of 48.35 at the end of the day. The DIIs were net buyers with 904.82Cr and FIIs were net sellers with -494.21Cr. Total 17 stocks advanced and 32 declined from the Nifty50 stack leaving one unchanged..
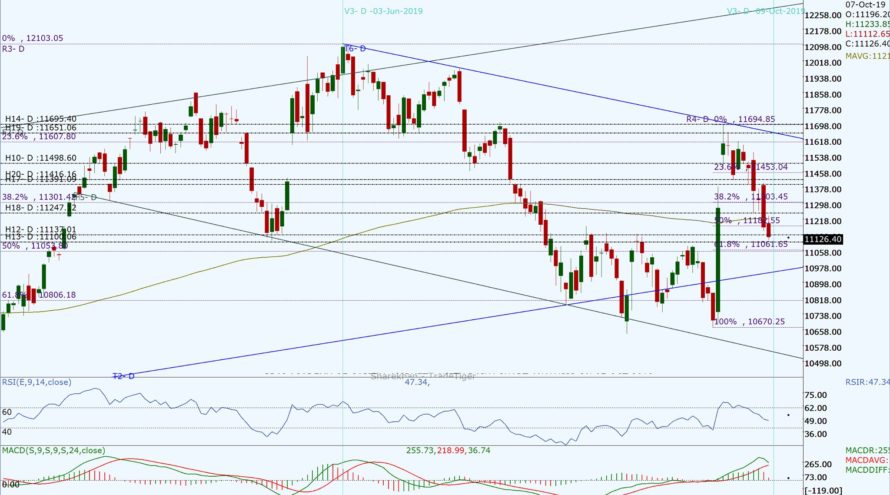
Monday’s closing at 11,126.4 is way below the daily Pivot at 11,244.47 and the weekly Pivot at 11,295.77. Although, the Index is midway of the descending channel on the daily chart its approaching the lower trend line of the ascending channel. It has got multiple layers of resistance to cap the upside on the daily chart. Stochastic has already entered the oversold zone at 8.36. RSI has further weakened and is at 47.34 while MACD is still above zero with a bullish crossover however, with weakening strength. Nifty has retraced more than 50% and now close to the 61.8% retracement level. The market may reverse from the Golden Fibonacci level of 11,061 if it gets strong domestic and international cues to continue its bullish journey.
Nifty’s new resistance levels have shifted downwards 11,137, 11,197, 11,258, 11301 (38.2% Fib from 26 Oct 2019), 11,350, 11,370 (50% Fib 03 June), 11,418.90 and 11,453 (23% Fib recent high). The support levels can be seen from the Nifty Daily chart at 11,100, 11061.65 (61.8% Fib Level from recent high) and 11,000. If Nifty breaks below 11,061 on closing and the sustainable basis on the daily chart it may revisit old low at 10,670. Looking at current immediate support and resistance level for the next trading day seems to be from 11,000 to 11,300.
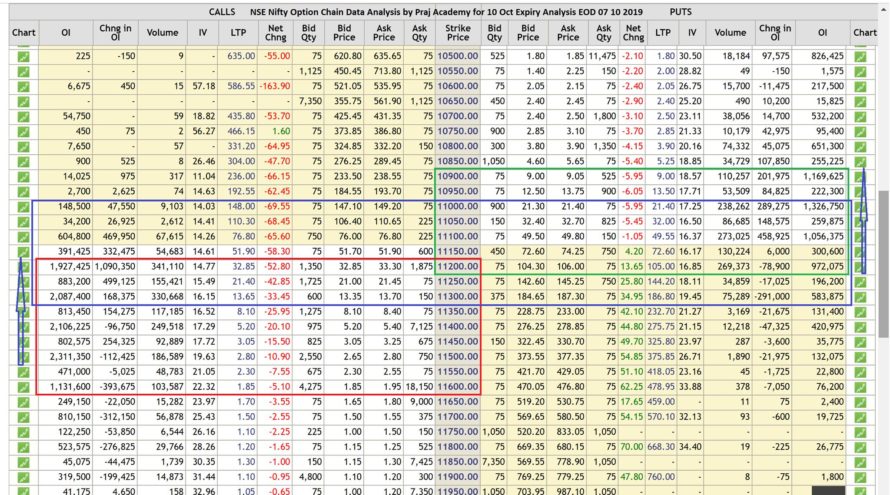
As per Option Chain data, the trading range of nifty seems to be from 11,000 to 11,400 for this expiry as of now. With such a wide range in options data, the market may witness some volatile swings. New put writing was seen at 10,900, 11,000 levels and call writing was seen at 11,200 and 11,300 shifting support and resistance levels down consistently. Looking at the Open Interest data at various strike rates along with the strike shifting forces indicate the possibility of the next trading range between 11,000 and 11,300. The PCR @EOD is 0.565, which indicates bearishness.
Technical analysis with a sound understanding of the market is the key to trading success, however, sometimes, unexpected (domestic or international) factors make the technical analysis go haywire for a while. Market forces are stronger than our analysis sometimes, and we have to monitor fresh data and new dynamics of the market during trading hours to consistently make money.
We trust the information provided will be helpful in your own analysis of the market and make trading a profitable and better experience. The information has been shared for educational purposes. Please seek your financial adviser’s guidance before trading or investing.
Happy Trading and Keep investing safely!
08
Oct
Nifty and Market Analysis @ EOD on 07 10 2019
-
Authoradmin
-
Comments0 Comments
-
Category
Tags:


