Nifty and Market Analysis @ EOD on 06 09 2019…..
And where is it heading next week from Sept 09 to 12th, 2019?
Today, on Sept 06, bulls hijacked the Nifty across the day. Nifty opened with a gap up at 10,883.8 and started with a net gain of 43 points. It closed at 10,946.2 making a bullish candle on daily chart with a net gain of 98.3 points during the day. Nifty entered its Ascending channel but got resistance at upper levels. Bulls ensure to close the price above 10,900 level which is well above Fib 61.8% level, w.r.t. low of 23rd August, which is placed at 10,806.18. Nifty is making higher highs and higher lows for last three consecutive days.
Today’s closing is above daily Pivot at 10,861.33 but below Weekly Pivot at 10,973.85. On weekly chart it made a Dragon Fly Doji at Golden Fibonacci level which indicates bullishness. However, the closing price is also near the resistance of Descending Channel on daily chart at 10950 for next trading day, thus creating journey of bulls difficult.
Consolidation of Nifty continues before any large move for which Bollinger bands have started squeezing for quite some time now. Nifty Index is surrounded with resistance at 10,950 (Descending Channel resistance), 10,961 (3rd Sept opening), 10,973.5, 11,000. 11,023.9, 11,053.8 (50% Fib Level) and 11,100 shifting its resistance level upwards. The trend line of the descending channel may push the market down as time goes by. To move up with velocity Nifty will need strong external cues for domestic and international markets.
On the downside, it has support 10,846, 10,806 (61% Fib wrt 26 Oct 2018), 10,746 (today’s Low), 10,700 (Support of 23rd Aug) and 10,637. To resume its bullish move Nifty needs to cross and sustains above 11,150 on a closing basis until then Nifty may consolidate within this wide range of 10,700 to 11,100.
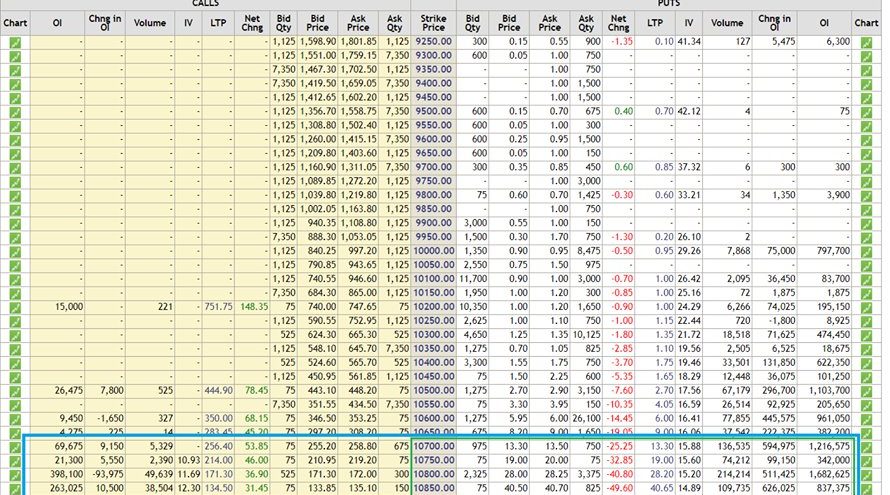
As per Option Chain data the trading range has broadened and moved both the sides from 10,700 to 11,100. The calls and puts were being written at lower levels 10,700 as well as higher levels at 11,200 from previous sessions, thus shifting Support and Resistance levels downwards. Since the Option Chain range remains broadened it may lead to volatility in the market in coming week.
PCR @EOD (for Nifty Expiry on 12 Sept OC) is at 1.21 which indicates a bullish outlook for the week at present. The PCR for September month (including all three expires) is at 1.20 giving brighter hopes to bulls.
We trust the information provided will be helpful in your analysis of the market and make trading a profitable and better experience. The information has been shared for educational purposes. Please seek your financial adviser’s guidance before trading or investing.
Happy Trading and Keep investing safely!


