-
Authoradmin
-
Comments1 Comment
-
Category
Accumulation Zone (AZ)–
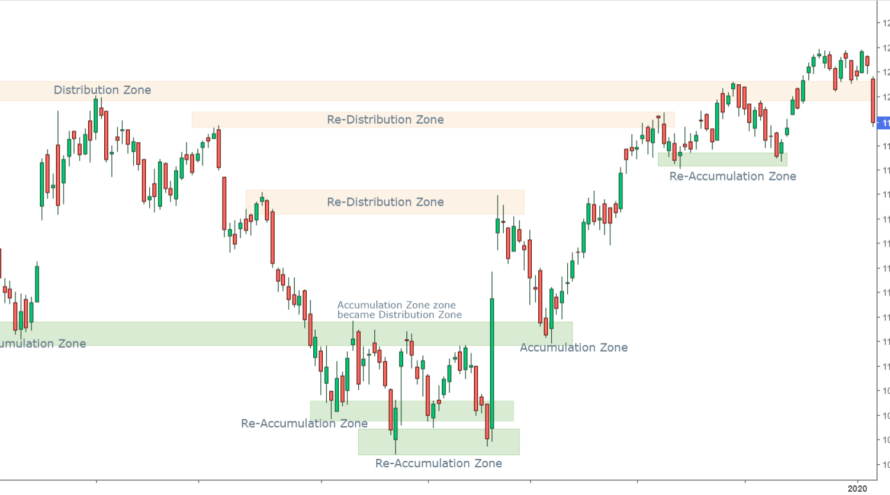
Accumulation Zone is where traders are willing to buy the stock aggressively because the AZ/DZ balance has shifted to the demand side. Here, at this point the buyers are dominant and the sellers are weak.
The accumulation area represents a period of implicit buying of shares, typically by institutional buyers, while the price remains fairly stable.
When a stock price doesn’t fall below a certain price level, and moves in a sideways range for an extended period, this can be an indication to investors that the stock is being accumulated by investors and as a result will be moving up soon.
Distribution Zone (DZ)–
At Distribution Zone traders are willing to sell the stock aggressively because the DZ/AZ balance has shifted to the distribution side. Here, at this point the sellers are dominating and the buyer are weak.
Distribution is an important dynamic that institutional investors must manage to avoid precipitous drops in stock prices
Key Points-
- Market gives you multiple opportunities of Buying and Selling by Re-accumulation Zone and Re-Distribution Zone
- Accumulation / Re-accumulation zones can becomes distribution/Re-distribution zones over a period in the Stock Market
- Accumulation Zone is where one should buy (accumulate) and Distribution Zone is where one should sell (distribute)
Note – Accumulation and Distribution Zones are a great way to identify areas of buying and selling as well as support and resistance, but they work best when combined with other kinds of technical analysis. The Technical Analysis Course at the “Praj Academy of Capital Markets” provides a comprehensive overview of both chart patterns and technical indicators, as well as how they can be used to make educated projections and manage risk.


