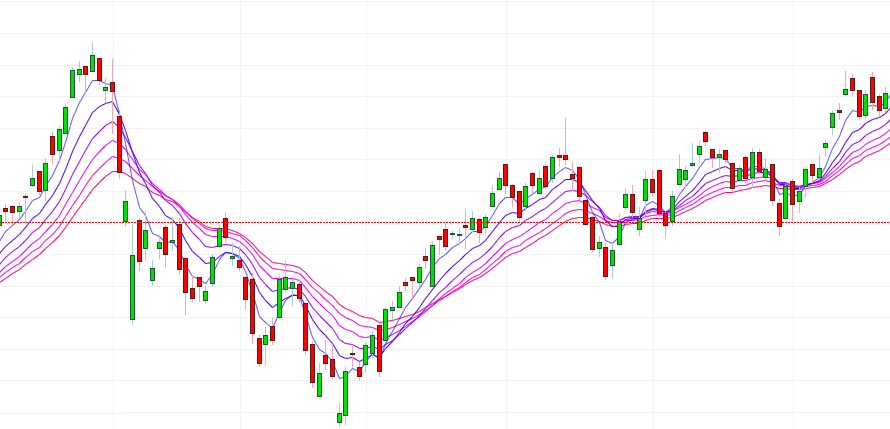
Pivot points/lines are used to predict support and resistance levels in the current or upcoming session. These support and resistance levels can be used by traders to determine entry and exit points, both for stop-losses and profit-taking.
A trader should always know the daily, weekly as well as monthly pivots to identify short, intermediate and long terms trend of the market or stock
A smart Trader should always keep yearly pivots in his business plan as the major corrections take support at yearly Pivot Levels
How to Calculate Pivot Points –
There are several different methods for calculating pivot points, the most common of which is the five-point system. The pivot point (P) of a market is the arithmetic average of the high (H), low (L), and closing (C) prices of the market in the prior trading period. It uses the previous day’s high, low, and close, along with two support levels and two resistance levels (totaling five price points), to derive a pivot point. The equations are as follows:
P = (H + L + C) / 3.
Sometimes, the average also includes the previous period’s or the current period’s opening price (O):
P = (O + H + L + C) / 4.
In other cases,
Traders like to emphasize the closing price, P = (H + L + C + C) / 4, or
The current periods opening price, P = (H + L + O + O) / 4.
Interpreting and Using Pivot Points –
The pivot point itself is the primary support and resistance when calculating it. This means that the largest price movement is expected to occur at this price. The other support and resistance levels are less influential, but they may still generate significant price movements.
Pivot points can be used in two ways. The first way is to determine the overall market trend. If the pivot point price is broken in an upward movement, then the market is bullish. If the price drops through the pivot point, then it’s is bearish.
The second method is to use pivot point price levels to enter and exit the markets. For example, a trader might put in a limit order to buy 100 shares if the price breaks a resistance level. Alternatively, a trader might set a stop loss at or near a support level.
While at times it appears that the levels are very good at predicting price movement, there are also times when the levels appear to have no impact at all. Like any technical tool, profits won’t likely come from relying on one indicator exclusively.
The success of a pivot point system lies squarely on the shoulders of the trader and depends on their ability to effectively use it in conjunction with other forms of technical analysis. These other technical indicators can be anything from a MACD to candlestick patterns or using a moving average to help establish the trend direction.
The greater the number of positive indications for a trade, the greater the chances for success.
Note – Pivot points are a great way to identify areas of support and resistance, but they work best when combined with other kinds of technical analysis. The Technical Analysis Course at the “Praj Academy of Capital Markets” provides a comprehensive overview of both chart patterns and technical indicators, as well as how they can be used to make educated projections and manage risk.


