Where is Nifty heading on Feb 06, 2020?
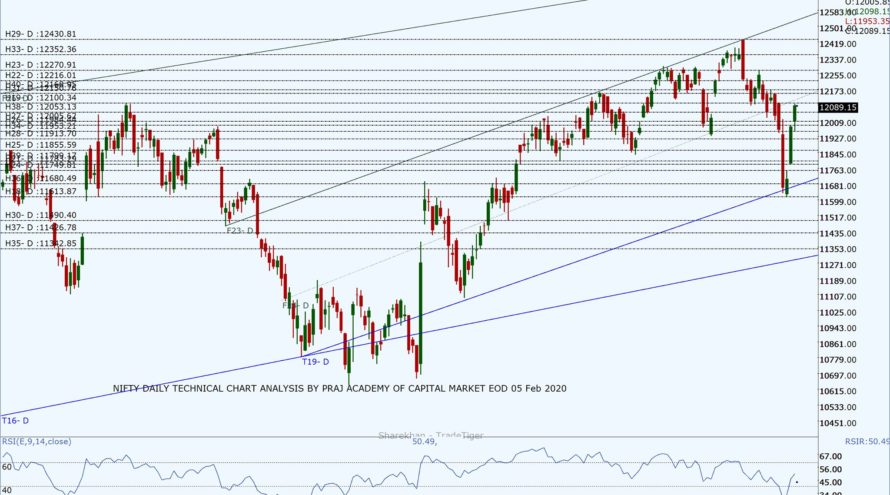
The benchmark Nifty made a handsome comeback with a gap up by 26 points and closing at 12,090.25 with a net gain of 109.50 points. It consistently rose up during the day on positive cues from international markets and drop in crude oil prices. It made a large bullish candle on the daily chart along with the last two green candles, it seems like three white soldiers. On the weekly chart, Nifty made a bullish piercing candle whereas, on a monthly chart, it has made a bullish hammer candle.
The DIIs were buyers with a turnover of 248.94Cr while FIIs were also buyers with a turnover of 262.75Cr. A total of 36 stocks advanced and 14 declined from the stack of nifty 50. Nifty closing at 12,090.25 is well above the 50 DEMA at 12,050, 200 DEMA at 11,671, daily Pivot at 11,916 and the weekly pivot at 11,837 indicating bullishness. The stochastic is at 60 while RSI is at 50 indicating the market is out of oversold zone hence some consolidation with a bullish bias can be expected.
Nifty’s new resistance levels are 12,118, 12,150, 12,168 and 12,216 while the support levels are at 12.053, 12,005, 11,984 and 11,953. The next day trading range seems to be from 11,953 to 12,168. Nifty will be searching for positive cues from domestic and international markets to maintain up move as long as it remains in the ascending channel and above 12,118.
Bank Nifty also followed the broader market today closing at 31,001 making a large bullish candle. New resistance levels are at 31,065, 31,226, 31,301 and 31,450 while as support levels at 30,910, 30,760, 30,621 and 30,510. The Trading range looks between 30,500 to 31,450 with volatility.
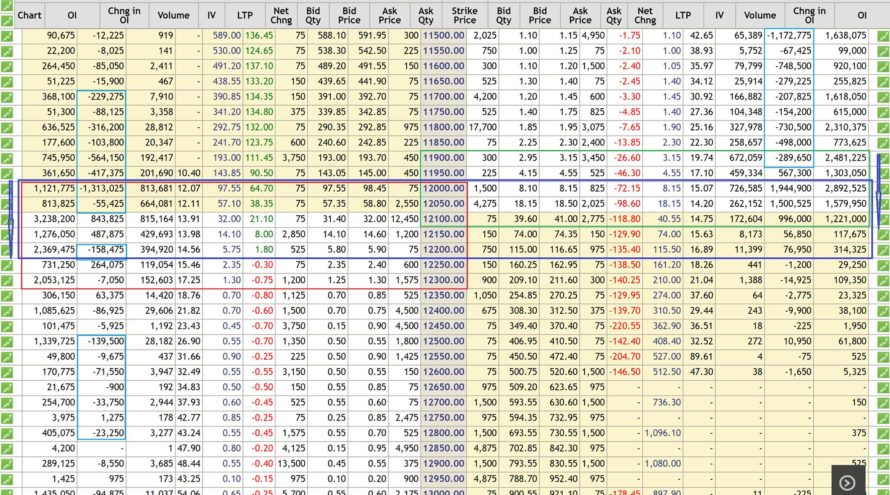
As per new Option Chain data (6 Feb), Call writing was seen at 12,100 and 12,150 whereas new Put writing was observed at 12,000 to 12,100. Call unwinding was seen across 12,000,12050 and 12,200 whereas small Put unwinding was seen below 11,900. Max OI in PE is at 12,000 and CE is at 12,100. The Call & Put range remains widened 11,500 to 12,500 indicating volatility is still in the market. OI data shows the possibility of the next trading range between 12,000 to 12,200 with some consolidation taking place.
Technical analysis with a sound understanding of the market is the key to trading success; however, unexpected (domestic or international) factors make the technical analysis go haywire for a while, hence we have to monitor fresh data and new dynamics of the market during trading hours to consistently make money. We trust the information will be helpful in your own analysis of the market and make trading a profitable and better experience. This analysis has been shared for educational purposes. Please seek your financial adviser’s guidance before trading or investing.
Happy Trading and Keep investing safely!


