And where is Nifty heading on Dec 05 with weekly expiry of Options?
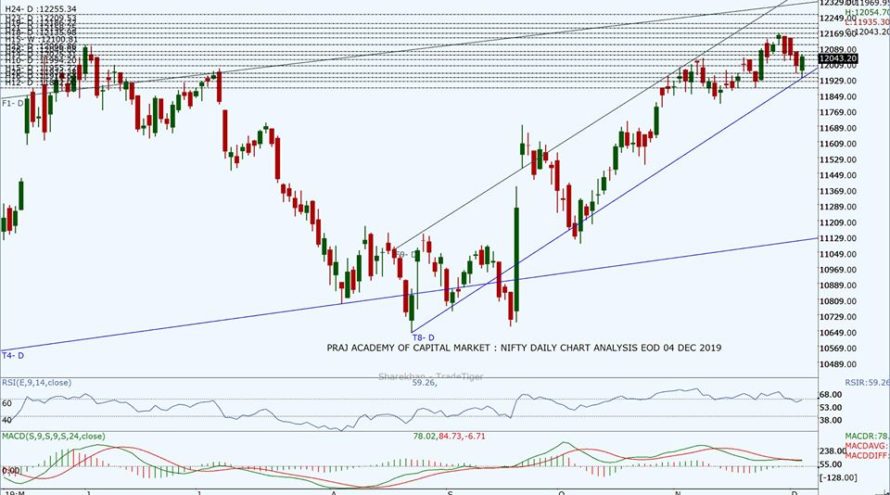
Nifty opened a gap down of 24.25 points at 12,969.95 and mover toward the resistance level at 12,029 where it witnessed heavy profit-booking by FIIs taking Nifty to the days lowest at 11,935.30. We had expected Nifty to be in the range of 11,900 to 12,150 with volatility for the intraday trade in our previous technical analysis. Nifty closed at 12,043.20 above the crucial 13DEMA at 12,010 making Bullish Piercing candle on daily chart following cooling of the US-China trade tensions and positive European markets. The market remained cautious before RBI’s monitory policy outcome on 5th Dec 2019.
The DIIs were net buyers with 904.13Cr and FIIs were net sellers with -781.06Cr. Total 34 stocks advanced, and 16 declined from the stack of nifty 50. On the weekly chart, it has made a Bullish Hammer kind of candle with expanding Bollinger Band indicating the midterm bullish strength is still there. In 60 minutes, Nifty has revered from the lower trend line and needs good domestic and international cues to move towards 12,150 and 12,200 if able to break out above 12,135 which is a key resistance level at present.
Today’s closing at 12,043.20 is just above the daily Pivot at 12,006 but well above the weekly Pivot at 12,044.87 and 200 DEMA at 11,411. The Index is well above the midway of the daily ascending channel and has got multiple resistances near the upper trend line. Stochastic, at 31.47, has come out of the overbought zone whereas RSI is at 59.26 and MACD is above zero with Signal and the MACD line converged.
Nifty’s new resistance levels have shifted upwards to 12,048, 12,086, 12,100, 12137 and 12,158 and12,186. The support levels can be seen from the Nifty Daily chart at 12,025, 11,994, 11,986, 11,955 and 11,935 and 11,914. Looking at current immediate support and resistance level for the next trading day seems to be from 11,950 to 12,150. The Nifty needs a big tailwind to go above 12,160 for a bullish breakout towards 12,255 or below 11,935 it may initiate a downside corrective move towards 11,900 or 11,855.
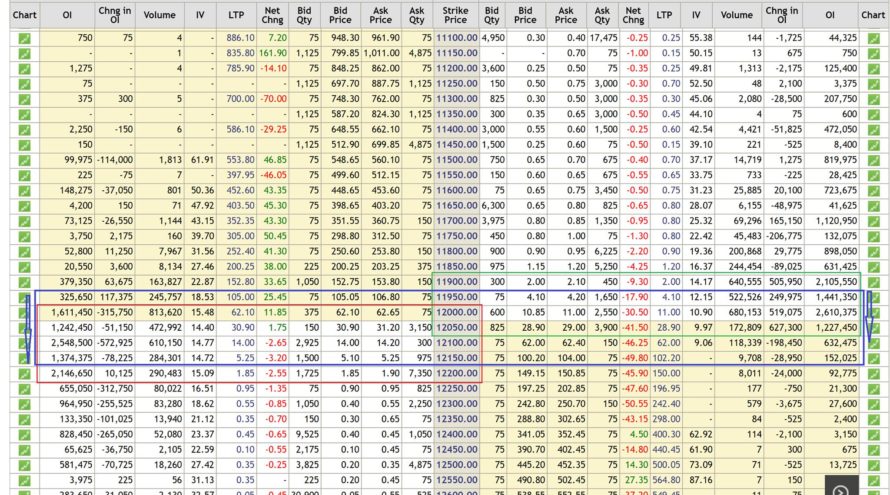
As per Option Chain data new Put writing was seen at higher levels like 12,000 and 12,150 and call unwinding at 12,000, 12,050, and 12,100 levels. The trading range remains wide indicating volatility on the day of expiry. Looking at the Open Interest data at various strike rates along with the strike shifting forces indicate the possibility of the next trading range between 11,950 to 12,150. The current PCR has increased from 0.80 to 1.00 which indicates some consolidation and correction. If the index moved toward 12,150 some profit booking may start which may lead to volatility and choppiness in the market.
Technical analysis with a sound understanding of the market is the key to trading success, however, sometimes market forces are stronger than the past analysis. Unexpected (domestic or international) factors make the technical analysis go haywire for a while, hence we have to monitor fresh data and new dynamics of the market during trading hours to consistently make money. We trust the information will be helpful in your own analysis of the market and make trading a profitable and better experience. This analysis has been shared for educational purposes. Please seek your financial adviser’s guidance before trading or investing.
Happy Trading and Keep investing safely!


