And where is it heading this weekend for new series expiring Oct 10, 2019?
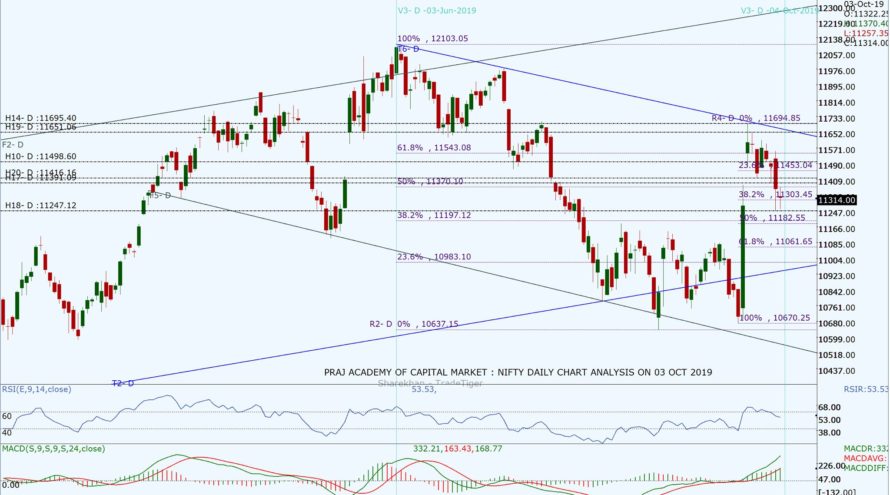
Nifty opened the gap down with a loss of 37.65 points at 11,322.25. The negative sentiment driven by Bank frauds, weak global cues were good enough for bears to maintain the control and drag Nifty downwards. It closed at 11,314 with a net loss of 45.9 points making a spinning top Doji, which represents indecisiveness, on the daily chart. Nifty witnessed buying below 11,300 level. The DIIs were net buyers with 862.542 Cr and FIIs were net seller with -810.72 Cr. Total 19 stocks advanced and 31 declined from the stack of nifty 50.
Today’s closing at 11,314 is below the daily Pivot at 11,387.33 and the weekly Pivot at 11,541.12. Although, the Index is well midway of the ascending channel on the daily chart, however, it has got multiple resistances near the upper trend line of a descending channel on the daily chart. Breakout from this descending channel is crucial for the up move. Stochastic has cooled off at 26.91 and has come out of the overbought zone. RSI is at 53.53 while MACD is above zero with bullish cross over. Nifty is consolidating between 11,258 and 11,453 and needs good and big tailwind to have a bullish breakout.
Nifty’s new resistance levels have shifted downwards 11,350, 11,370 (50% Fib 03 June), 11,418.90, 11,453 (23% Fib recent high) 11,500, 11,524, 11,543, 11,607.8 (23% Fib from 03 June 2019), 11,650 and 11,695.4. The support levels can be seen from the Nifty Daily chart at and 11301 (38.2% Fib from 26 Oct 2019), 11,273, 11,258 and 11,197. If Nifty breaks below 11,258 it may head toward Golden Support at 11061 (61.8% Fib) from low of 19th Sept. Looking at current immediate support and resistance level for the next trading day seems to be from 11,258 to 11,450.
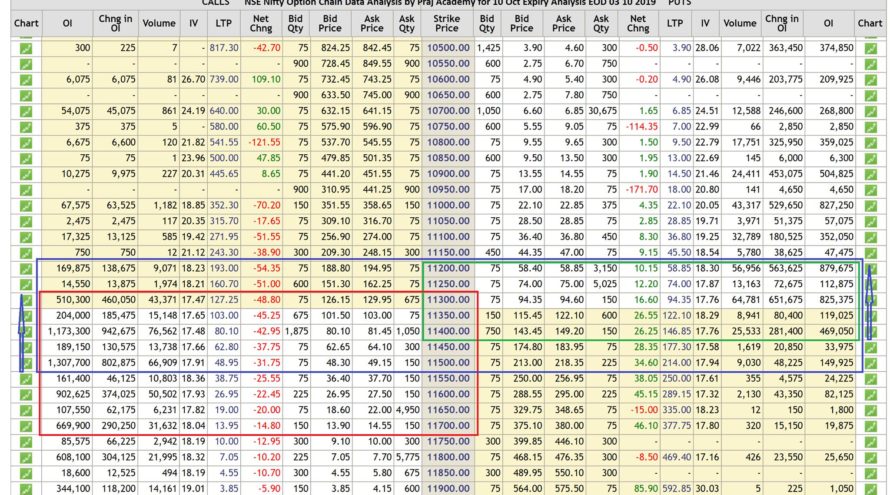
As per Option Chain data the trading range of nifty seems to be from 11,200 to 11,700 with volatile swings for the next weekly series of Oct Option Chain. New put writing was seen at 11,100, 11,200 levels and call writing was seen at 11,400 and 11,500 shifting support and resistance levels down. Looking at the Open Interest data at various strike rates along with the strike shifting forces indicate the possibility of the next trading range between 11,250 and 11,550. PCR @EOD has increased to 0.82 from 0.54 which indicates a little bit of bullishness building up, however, relative bearishness remains as per PCR. The market may remain in consolidation mode for some time till it breaks out either side.
Technical analysis with a sound understanding of the market is the key to trading success, however, sometimes, unexpected (domestic or international) factors make the technical analysis go haywire for a while. Market forces are stronger than our analysis sometimes, and we have to monitor fresh data and new dynamics of the market during trading hours to consistently make money.
We trust the information provided will be helpful in your analysis of the market and make trading a profitable and better experience. The information has been shared for educational purposes. Please seek your financial adviser’s guidance before trading or investing.
Happy Trading and Keep investing safely!


