And where is it heading this weekend expiry on Oct 03, 2019?
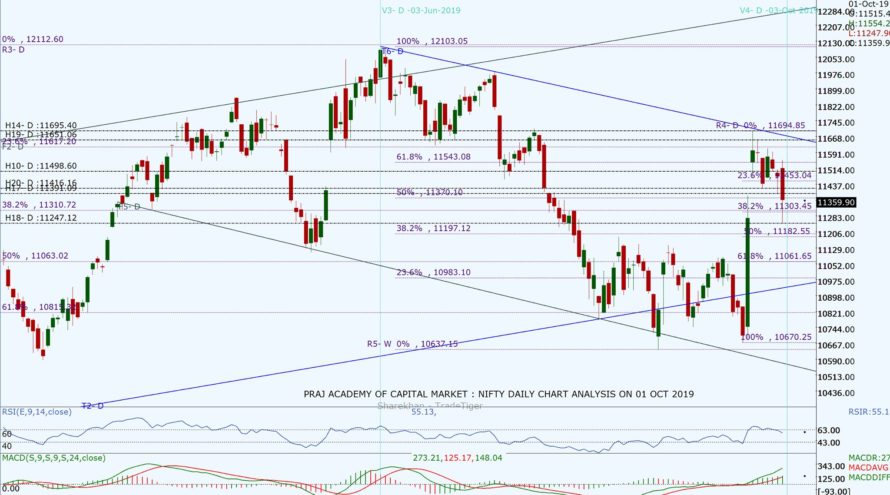
Nifty opened the gap up with the gain of 41 points at 11,515.40 above the crucial support levels of 11,453 and 11,500. The negative sentiment driven by PMC Bank fraud, Laxmi Vilas Bank under RBI PCA and other banks’ exposure to NBFC nosedived BankNifty almost 1,000. Bears flexed their muscle to take control from bulls and dragged Nifty well below closing at 11,359.90 with a net loss of 114.55 points.
The DIIs were net buyers with 1503.02 Cr and FIIs were net seller with –1298.56 Cr. Total 11 stocks advanced and 39 declined from stack of nifty 50. Nifty made a large bearish candle on a daily chart with some buying at lower levels. Nifty has been forming a flag pattern in its consolidation phase. On the weekly chart, it has made another Spinning Doji but with a gap down reflecting a bearish evening star. On 60 minutes it made a flag pattern and filed up the novice gap the bulls had created on 23 Sept 2019.
Today’s closing at 11,359.90 is below the daily Pivot at 11,457.83 and the weekly Pivot at 11,541.12. Although, the Index is well midway of the ascending channel on the daily chart, however, it has got multiple resistances near the upper trend line of a descending channel on the daily chart. Breakout from this descending channel is crucial for the up move. Stochastic has cooled off at 32.35 and has come out of the overbought zone. RSI is at 55.13 while MACD is above zero with bullish cross over.
Nifty’s new resistance levels have shifted downwards 11,370 (50% Fib 03 June), 11,418.90, 11,453 (23% Fib recent high) 11,500, 11,524, 11,543, 11,607.8 (23% Fib from 03 June 2019), 11,650 and 11,695.4. The support levels can be seen from the Nifty Daily chart at 11,350 and 11301 (38.2% Fib from 26 Oct 2019), 11,273, 11,258. If Nifty breaks below 11,258 it may head toward Golden Support at 11061 (61.8% Fib) from low of 19th Sept. Looking at current immediate support and resistance level for the next trading day seems to be from 11,258 to 11,450.
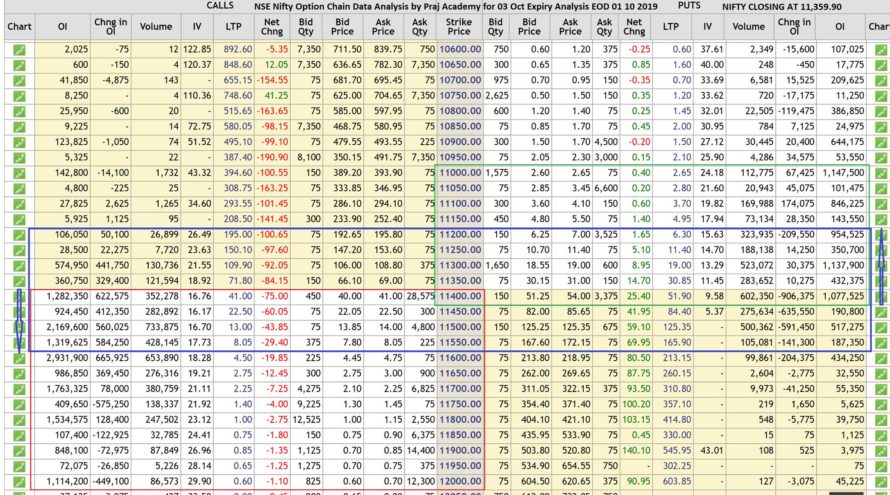
As per Option Chain data the trading range of nifty seems to be from 11,200 to 11,700 indicating volatility for October series Option Chain. New put writing was seen at 11,100, 11,200 levels and call writing was seen at 11,400 and 11,500 shifting support and resistance levels down. Looking at the Open Interest data at various strike rates along with the strike shifting forces indicate the possibility of the next trading range between 11,250 and 11,550.
PCR @EOD has reduced to 0.54 from 0.79, which indicates a strong bearishness. The market may remain in consolidation mode for some time till it breaks out either side. Nifty will need a big tailwind to go above 11,695 for a bullish breakout.
Technical analysis with a sound understanding of the market is the key to trading success, however, sometimes, unexpected (domestic or international) factors make the technical analysis go haywire for a while. Market forces are stronger then our analysis sometimes and we have to monitor fresh data and new dynamics of the market during trading hours to consistently make money.
We trust the information provided will be helpful in your analysis of the market and make trading a profitable and better experience. The information has been shared for educational purposes. Please seek your financial adviser’s guidance before trading or investing.
Happy Trading and Keep investing safely!


