And where is it heading this week from 01 Oct to Oct 03, 2019?
Nifty opened the gap down with the loss of 21 points at 11,491.15 above the crucial support level 11,453. Nifty has been in consolidation mode and gaining strength before the next move. Market closed at 11,474.45 with a net loss of 155 points due to strong USD, mixed cues from the global market and uncertainty of the US-Chino trade pacts.
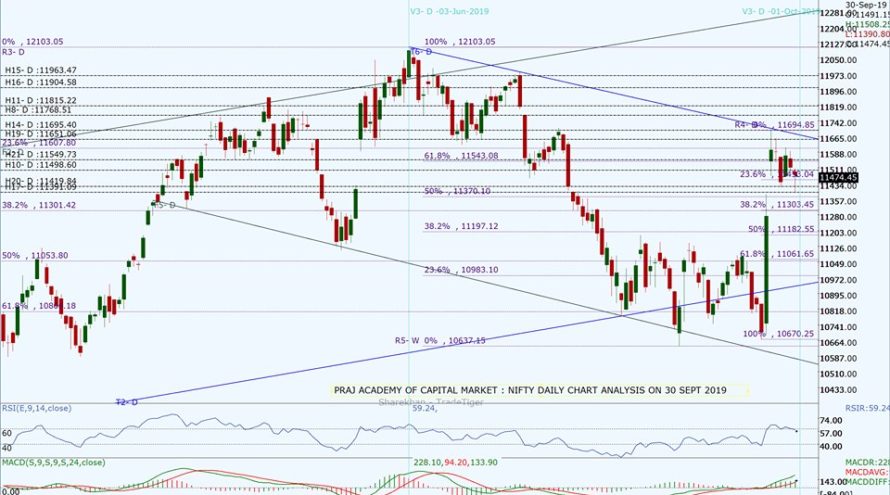
The DIIs were net buyers with 504.69 Cr and FIIs were net seller with –469.4 Cr. Total 22 stocks advanced and 28 declined from stack of nifty 50. Nifty made a hammer candle on a daily chart which is a bullish candle as it represents buying at lower levels. Nifty has been forming a flag pattern in its consolidation phase. On the weekly chart, it has made a Dragonfly Doji after a Spinning Doji but with a gap down reflecting a bearish evening star on the first day of the week. On 60 minutes it made a flag pattern that can give a net gain of approx 125 points with a target of 11,695, on an upward breakout, to the bulls. However, Nifty is still in consolidation mode which is natural after a big gain last week.
Today’s closing at 11,474.45 is below the daily Pivot at 11,535.25 and also the weekly Pivot at 11,541.12. Although, the Index is well midway of the ascending channel on the daily chart, however, it has got multiple resistances near the upper trend line of a descending channel on the daily chart. Breakout from this descending channel is crucial for the up move. Stochastic has cooled off at 51.3 and is slowly coming out of the overbought zone. RSI has gained strength and is at 59.24 while MACD is above zero with bullish cross over showing good strength of bulls continues.
Nifty’s new resistance levels have shifted upwards 11,500, 11,524, 11,543, 11,607.8 (23% Fib from 03 June 2019), 11,650 and 11,695.4. The support levels can be seen from the Nifty Daily chart at 11,462, 11,453 (23% Fib retracement of recent high) 11,418.9, 11,370 (50% Fib 03 June), 11,350 and 11301 (38.2% Fib from 26 Oct 2019). Looking at current immediate support and resistance level for the next trading day seems to be from 11,400 to 11,600. The Nifty needs a big tailwind to go above 11,695 for a bullish breakout towards 12,000 or below 11,370 it may initiate a downside corrective move towards 11,300.
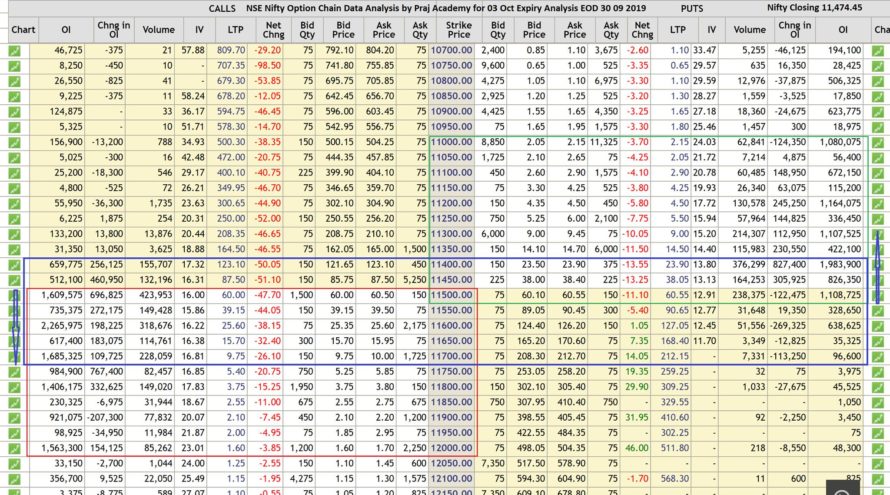
As per Option Chain data the trading range of nifty seems to be from 11,300 to 12,000 indicating volatility for October series Option Chain. New put writing was seen at 11,400, 11,500 levels and call writing was seen at 11,500 and 11,600. Looking at the Open Interest data at various strike rates along with the strike shifting forces indicate the possibility of the next trading range between 11,400 and 11,650. The weekly range for Nifty has broadened in 03 Oct series Option Chain from 11,300 to 12,000 thus indicating volatility may be seen in the market.
PCR @EOD has reduced to 0.79 from 0.91 which indicates a mild bearishness. The market may remain in consolidation mode for some time.
Technical analysis with a sound understanding of the market is the key to trading success, however, sometimes, unexpected (domestic or international) factors make the technical analysis go haywire for a while. Market forces are stronger then our analysis sometimes and we have to monitor fresh data and new dynamics of the market during trading hours to consistently make money.
We trust the information provided will be helpful in your analysis of the market and make trading a profitable and better experience. The information has been shared for educational purposes. Please seek your financial adviser’s guidance before trading or investing.
Happy Trading and Keep investing safely!


